
Figure 5.
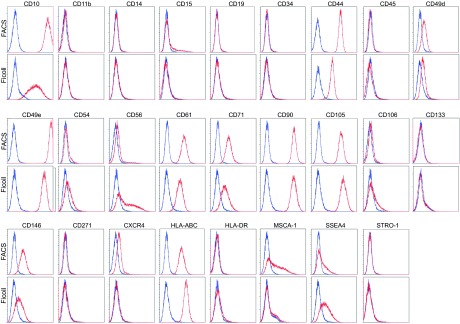
Immunophenotypic analysis of elutriated CD44− MSPCs. Single-color flow cytometric analysis of selected cell surface proteins on passage 3 culture-expanded CD45−CD73+CD90+CD105+CD44− cells (top panels in each row, FACS) compared with passage 3 donor-matched mesenchymal stem/stromal cells isolated using conventional methods (bottom panels in each row, Ficoll). Shown are representative images from one experiment. Similar results were seen in four other bone marrow samples from different donors. Blue line, isotype control; red line, primary antibody. Abbreviation: FACS, fluorescence-activated cell sorting.