Figure 7.
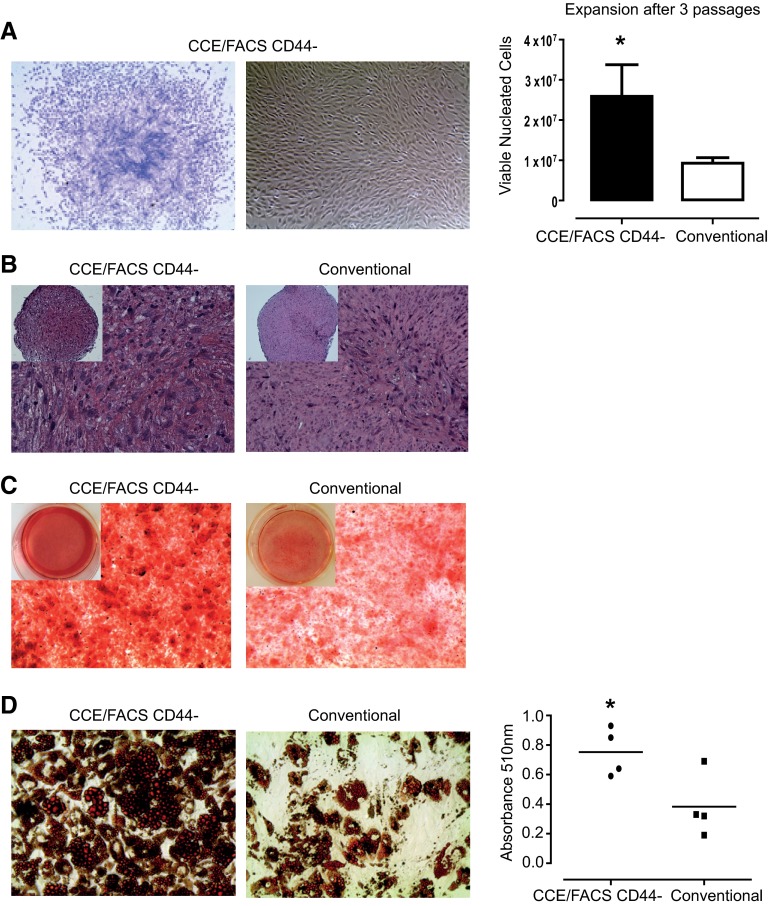
Trilineage differentiation potential of small CD45−CD73+CD90+CD105+CD44− cells obtained from fraction 90 following expansion. (A): In vitro growth of CCE/FACS CD44− cells obtained from fraction 90. Shown are a representative Giemsa-stained colony forming unit-fibroblast colony at day 12 (left) and the typical colony appearance by phase contrast (middle). After three passages, CCE/FACS-sorted cells demonstrated a greater expansion capacity compared with conventional mesenchymal stem/stromal cells (MSCs) (right). (B–D): After passage 3, cells were placed in differentiation conditions in vitro to induce osteogenesis, chondrogenesis, and adipogenesis. (B): To induce chondrogenesis, cell pellets were incubated with 10 ng/ml recombinant human transforming growth factor-β3. Chondrogenesis was detected following staining with safranin-O. A representative image of a CCE/FACS CD44− pellet (left) shows more intense staining compared with donor-matched conventional MSCs (right). (C): Osteogenesis was detected by staining cultures with 2% alizarin red S solution (pH 4.2). Shown is a representative image comparing osteogenesis cultures for CD44− cells (left) with cultures of donor-matched conventional MSCs (middle). The monolayer of CCE/FACS CD44− cells stained more densely with alizarin red S. (D): Adipogenesis was detected following staining of cultures with Oil Red O, which detects lipids. Representative images of CCE/FACS CD44− culture (left) compared with donor-matched conventional MSCs (middle) are shown (×20). Right panel shows spectrophotometric quantification of adipogenesis following isopropanol extraction of Oil Red O. Data are presented as mean ± SEM, n = 4–5. *, p < .05 versus conventional isolated MSCs, using an unpaired t test. Abbreviations: CCE, counterflow centrifugal elutriation; FACS, fluorescence-activated cell sorting.

