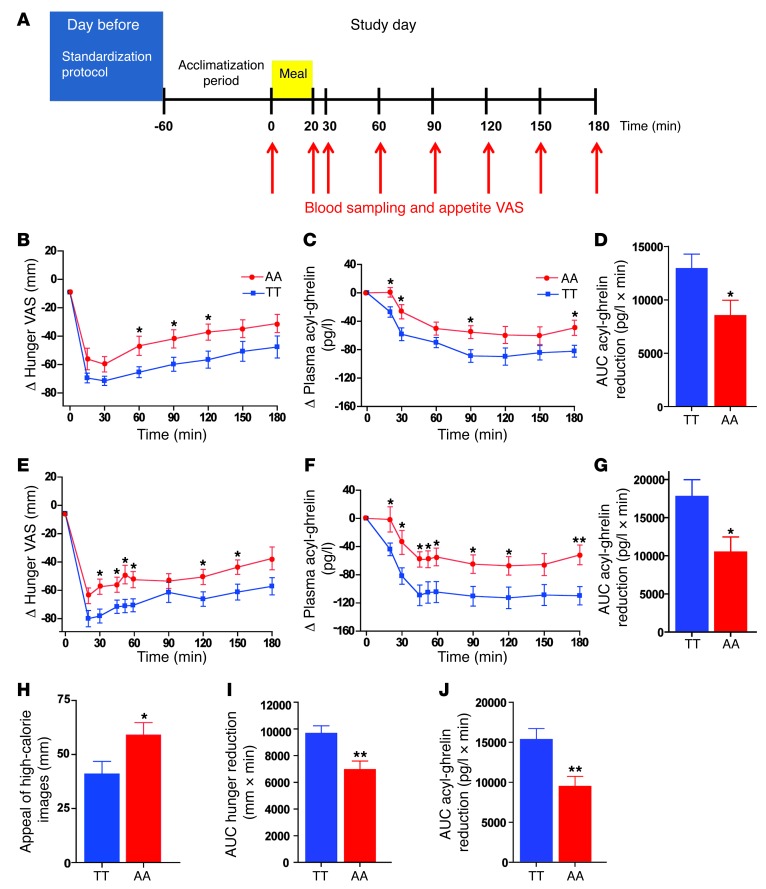
Figure 1. Hunger scores, plasma acyl-ghrelin levels, and appeal of hedonic images in TT and AA subjects.
(A) Standard test meal study protocol. On the day prior to the study, subjects consumed the same evening meal at 20:00, then fasted and drank only water. On the study day, a venous cannula was inserted into a left forearm vein, and a period of 1 hour was allowed for acclimatization. At t0, a baseline blood sample and appetite VAS were taken. Subjects were then given a standard test meal to consume within 20 minutes. Blood samples and appetite VAS were taken at t20 and t30 and every 30 minutes thereafter until t180. (B–D) Postprandial responses in 10 TT (blue squares) and 10 AA (red circles) adiposity-matched subjects to a meal at t0. (B) Δ Hunger, (C) Δ plasma acyl-ghrelin concentrations, and (D) AUC Δ acyl-ghrelin in TT (blue bar) and AA (red bar) subjects. (E–G) fMRI fed–study day postprandial responses in 12 TT (blue squares) and 12 AA (red circles) adiposity-matched subjects to a meal at t0. (E) Δ Hunger, (F) Δ plasma acyl-ghrelin concentrations, and (G) AUC Δ acyl-ghrelin suppression in TT (blue bar) and AA (red bar) subjects. (H) Postprandial appeal ratings of hedonic, high-calorie food images from 12 TT (blue bar) and 12 AA (red bar) fMRI study subjects. (I and J) Combined postprandial (I) AUC Δ hunger reduction and (J) AUC Δ acyl-ghrelin suppression in 22 TT (blue bars) and 22 AA (red bars) subjects. Data are presented as the mean ± SEM. *P < 0.05; **P < 0.01.

