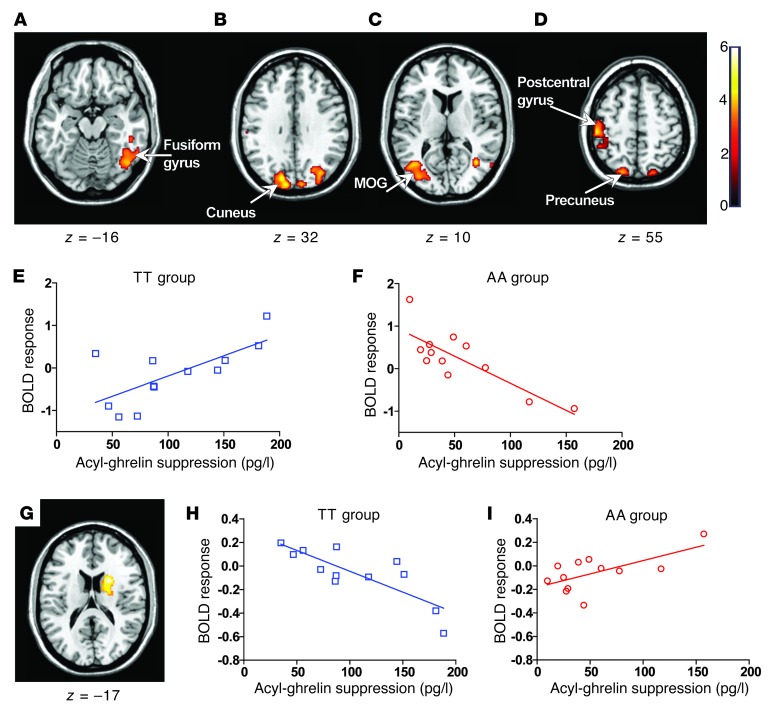
Figure 4. Modulatory effects of acyl-ghrelin on BOLD responses in the fed state.
(A–D and G) Axial slices with superimposed group activity. MOG, middle occipital gyrus. (A–D) Brain regions where the TT and AA groups significantly differed in their relationship between food-related (all food greater than non-food) BOLD response and postprandial circulating acyl-ghrelin suppression (t0–t54). P < 0.05, FWE corrected. The left side of each panel is the left side of the brain. z is the MNI space z coordinate of the axial slice. T color scale reflects the T score of the interaction. (E and F) Regression plots between food-related BOLD response and circulating postprandial acyl-ghrelin suppression (t0–t54) in TT (blue, open squares) and AA (red, open circles) subjects. Positive regression and negative coefficients (β) were found in the TT (E) and AA (F) groups, respectively. Plotted coefficients were extracted from the cluster peak within the left cuneus (MNI space x, y, and z coordinates for the peak cluster voxel cluster [–12, –92, 28]). (G) Right caudate nucleus where the TT and AA groups exhibited a divergent relationship between BOLD response to hedonic food images and postprandial circulating acyl-ghrelin suppression (t0–t54). (H and I) Regression plots between BOLD response to hedonic food images and circulating postprandial ghrelin suppression in TT (blue, open squares) and AA (red, open circles) subjects. Negative and positive βs were found in the TT (H) and AA (I) groups, respectively. Plotted coefficients were extracted from the cluster peak within the right caudate nucleus (MNI space x, y, and z coordinates for the peak cluster voxel [22, 8, 18].

