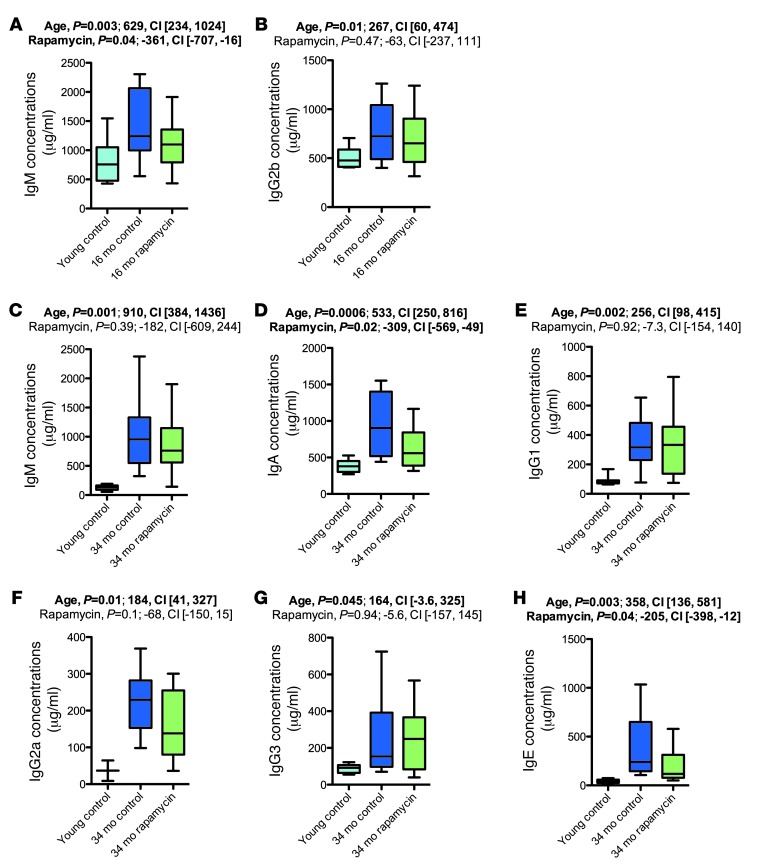
Figure 10. Rapamycin partially counteracted age-associated increases in plasma Ig concentrations.
Plasma Ig levels in the 16-month (A and B) and 34-month (C–H) cohorts. Whisker plots display minimum, 25th percentile, median, 75th percentile, and maximum. P values and fit coefficients with 95% confidence intervals are shown; statistically significant differences (P < 0.05) are denoted by bold font.

