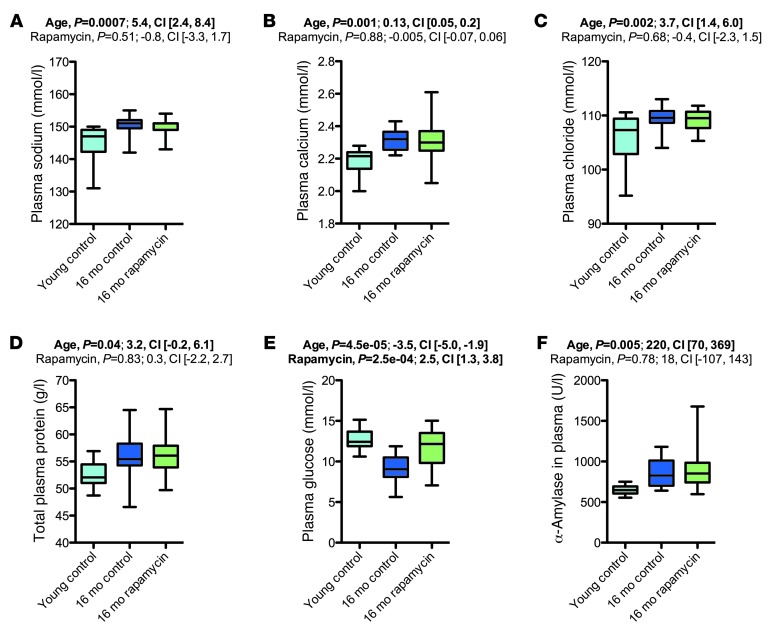
Figure 11. Rapamycin treatment had no apparent effect on most aging-associated changes on clinical chemistry parameters.
Shown are selected clinical chemistry results from the 16-month cohort (young control, n = 10; vehicle, n = 16; rapamycin, n = 19). (A) Plasma sodium concentration. (B) Plasma calcium concentration. (C) Plasma chloride concentration. (D) Total protein in plasma. (E) Plasma glucose. (F) Plasma α-amylase. Whisker plots display minimum, 25th percentile, median, 75th percentile, and maximum. P values and fit coefficients with 95% confidence intervals are shown; statistically significant differences (P < 0.05) are denoted by bold font. See Supplemental Figures 17–19 for complete clinical chemistry findings from all cohorts.

