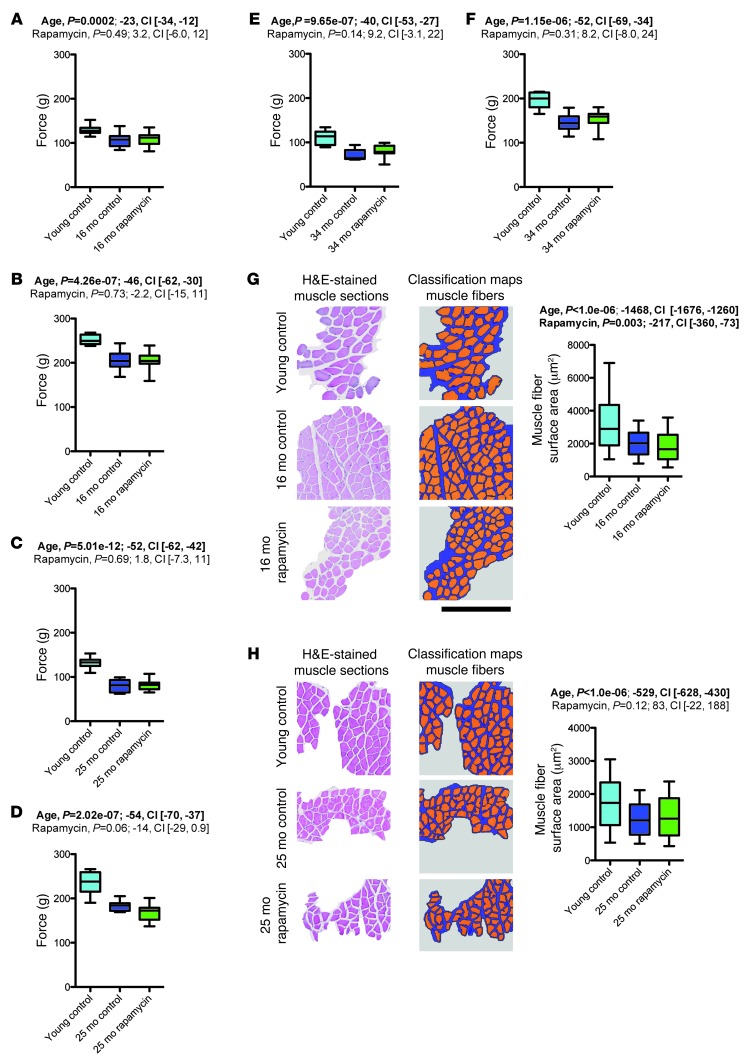
Figure 4. Rapamycin did not improve age-related reductions in grip strength and cross-sectional muscle fiber area.
(A–F) Aging-related decline in muscle strength was assessed using 2-paw (A, C, and E) and 4-paw (B, D, and F) grip strength tests in the 16-month (A and B; young control, n = 10; vehicle, n = 18; rapamycin, n = 20), 25-month (C and D; young control, n = 10; vehicle, n = 11; rapamycin, n = 16), and 34-month (E and F; young control, n = 10; vehicle, n = 9; rapamycin, n = 14) cohorts. (G and H) Muscle fibers were automatically identified on H&E-stained sections of quadriceps femoris muscle of the 16-month (G; young control, n = 786 muscle fibers from 5 mice; vehicle, n = 534 muscle fibers from 6 mice; rapamycin, n = 600 muscle fibers from 8 mice) and 25-month (H; young control, n = 330 muscle fibers from 6 mice; vehicle, n = 741 muscle fibers from 4 mice; rapamycin, n = 1,371 muscle fibers from 5 mice) cohorts using image segmentation and analysis software. Shown are examples of histological images and classification maps (generated via automated segmentation of histological images) along with quantification of cross-sectional muscle fiber area. Scale bar: 400 μm. Whisker plots display 25th percentile, median, and 75th percentile as well as minimum-to-maximum (A–F) or 10th to 90th percentile (G and H). P values and fit coefficients with 95% confidence intervals are shown; statistically significant differences (P < 0.05) are denoted by bold font.

