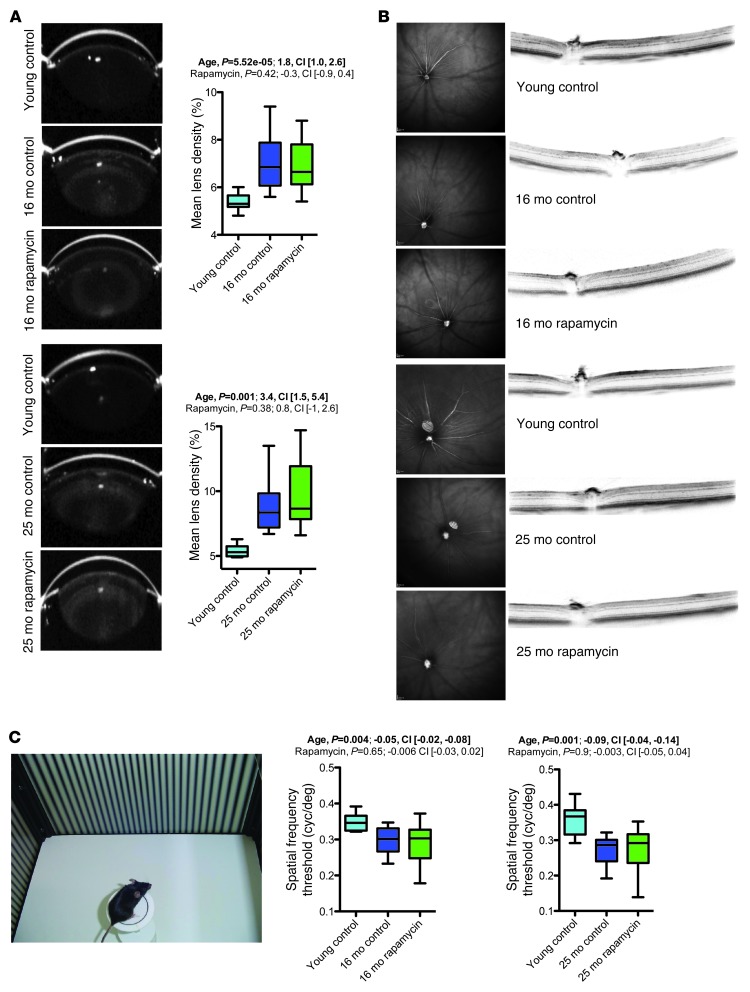
Figure 5. Rapamycin did not improve age-related ophthalmological impairments.
Summary of findings from ophthalmological assessment of the 16-month (young control, n = 10; vehicle, n = 18; rapamycin, n = 20) and 25-month (young control, n = 10; vehicle, n = 8; rapamycin, n = 14) cohorts. (A) Quantification of lens densities, assessed via Scheimpflug imaging; example images are also shown. (B) Optical coherence tomography was performed for in vivo assessment of the posterior part of the eye. Example images are shown. No age or treatment effects were noted. (C) Visual acuity was examined with the virtual drum test. Whisker plots display minimum, 25th percentile, median, 75th percentile, and maximum. P values and fit coefficients with 95% confidence intervals are shown; statistically significant differences (P < 0.05) are denoted by bold font.

