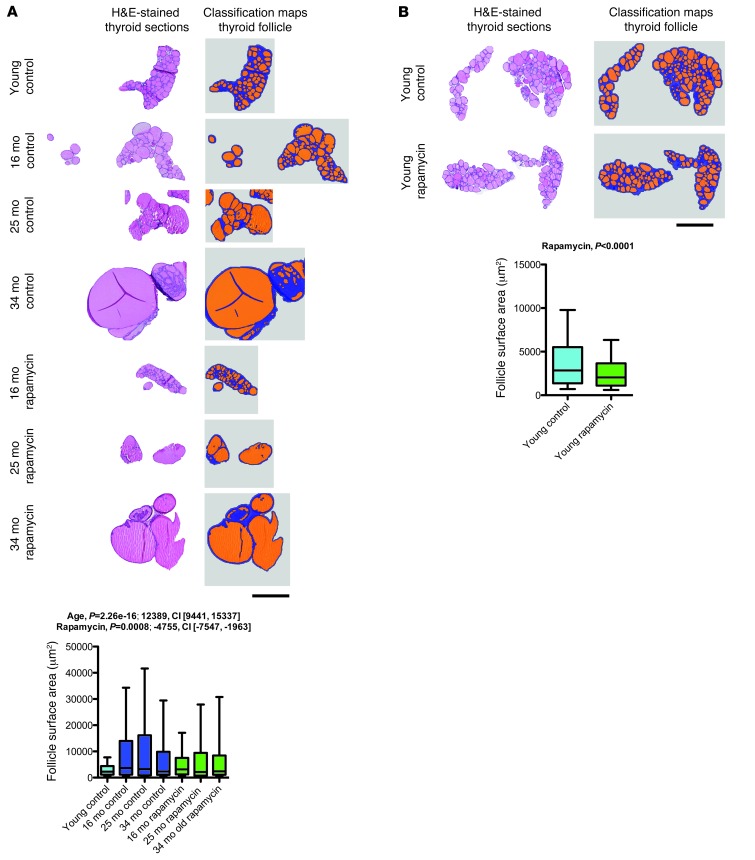
Figure 7. Rapamycin decreased thyroid follicle size in an aging-independent manner.
Thyroid follicles were automatically identified on H&E-stained thyroid sections using image segmentation and analysis software. Shown are examples of histological images and classification maps (generated via automated segmentation of histological images) along with quantification of follicle surface area. (A) Follicle size distribution in rapamycin- and vehicle-treated aged mice as well as young controls (young control, n = 1,428 follicles from 12 mice; 16-month vehicle, n = 566 follicles from 8 mice; 25-month vehicle, n = 241 follicles from 3 mice; 34-month vehicle, n = 440 follicles from 5 mice; 16-month rapamycin, n = 1,064 follicles from 10 mice; 25-month rapamycin, n = 277 follicles from 4 mice; 34-month rapamycin, n = 535 follicles from 8 mice). (B) Corresponding data from a comparison of young animals treated with rapamycin (n = 1,182 follicles from 8 mice) or vehicle (n = 1,543 follicles from 9 mice). Scale bars: 500 μm. Whisker plots display 10th percentile, 25th percentile, median, 75th percentile, and 90th percentile. P values and fit coefficients with 95% confidence intervals are shown; statistically significant differences (P < 0.05) are denoted by bold font.

