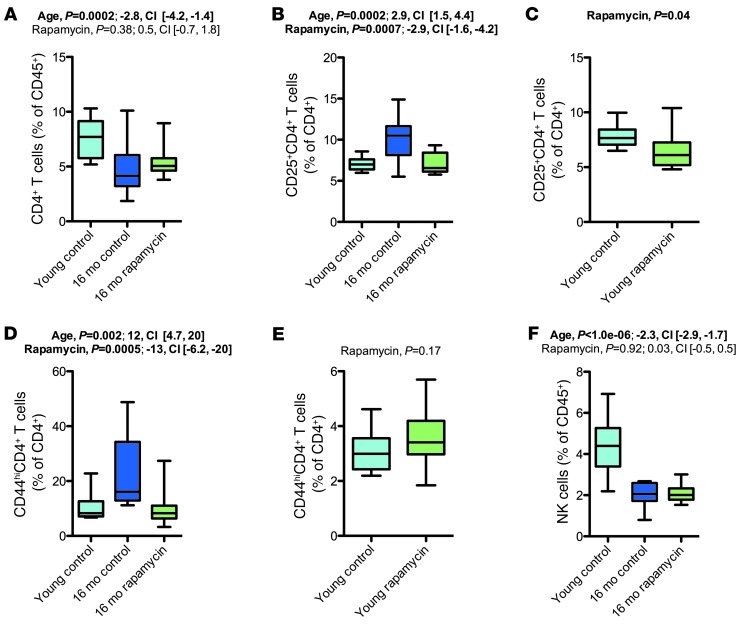
Figure 9. Rapamycin counteracted a subset of age-related changes in the T lymphocyte compartment.
(A) CD4+ T cell populations in the 16-month cohort. (B and C) CD25+CD4+ T cell populations in the 16-month cohort (B) and in young animals chronically treated with rapamycin or vehicle (C). (D and E) CD44hiCD4+ T cell populations in the 16-month cohort (D) and in young animals chronically treated with rapamycin or vehicle (E). (F) NK cell frequency in the 16-month cohort. Whisker plots display minimum, 25th percentile, median, 75th percentile, and maximum. P values and fit coefficients with 95% confidence intervals are shown; statistically significant differences (P < 0.05) are denoted by bold font. See Supplemental Figures 11–13 for complete datasets.

