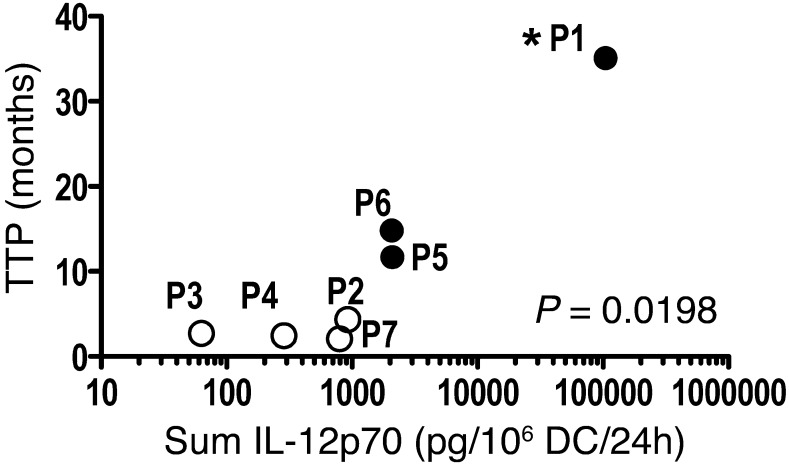
Figure 4. IL-12p70 production and TTP.
Cox regression analysis followed by likelihood-ratio test revealed a positive correlation between IL-12p70 production and TTP (P = 0.0198, log-rank). White symbols represent patients with rapid disease progression. Black symbols represent patients with confirmed clinical response (see Table 1). P1 showed complete remission as of 4 years after initiation of treatment (analysis performed on 08/05/12; asterisk); P5 and P6 showed a partial response, with disease progression observed at or after 11.5 months of treatment initiation. No correlation was observed between IL-12p70 production and immune response or between immune response and clinical outcome.

