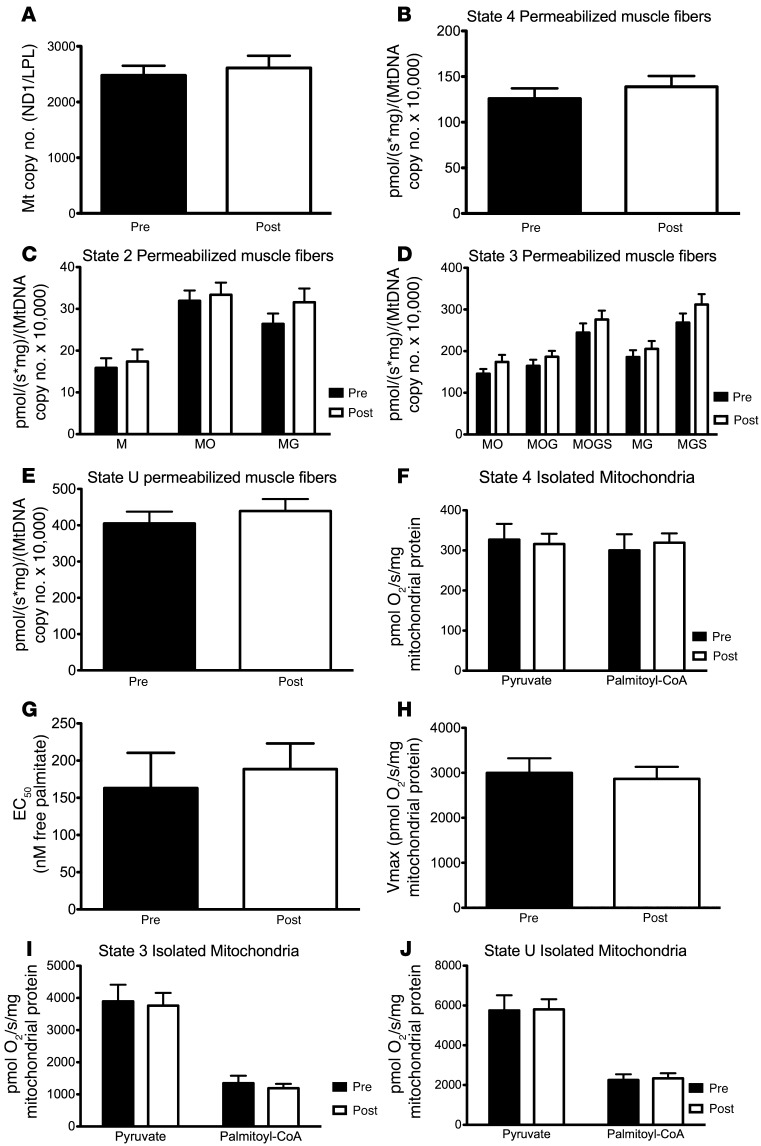
Figure 2. No effect of cold acclimation on SM respiration.
(A) Mitochondrial density (n = 16). Panels B–E represent the data from permeabilized muscle fibers (n = 16, 8 male/8 female) corrected for mitochondrial density, while G and H (n = 11, 5 male/6 female) and F–J (n = 9, 3 male/6 female) reflect the data from isolated mitochondria obtained in a subset of subjects. (B) Oxygen consumption not linked to ATP synthesis (state 4). (C) Oxygen consumption upon substrates only (malate, malate + octanoylcarnitine, malate + glutamate; state 2). (D) ADP-stimulated respiration (state 3) fuelled by various complex I– and complex II–linked substrates. (E) Maximally uncoupled respiration upon the chemical uncoupler FCCP. (F) Mitochondrial oxygen consumption not linked to ATP synthesis (state 4) on pyruvate and palmitoyl-CoA + carnitine. (G) Mean EC50 value of palmitate concentration-response curves. (H) Mean Vmax of palmitate concentration-response curves. (I) ADP-stimulated respiration (state 3). (J) Maximally uncoupled respiration upon FCCP fueled by pyruvate or palmitoyol-CoA + carnitine. The effects of cold acclimation on all SM parameters were tested with paired-samples t tests. Black and white bars represent the values before and after cold acclimation, respectively. Values are expressed as means with SEM. M, malate; G, glutamate; S, succinate; O, octanoyl-carnitine.

