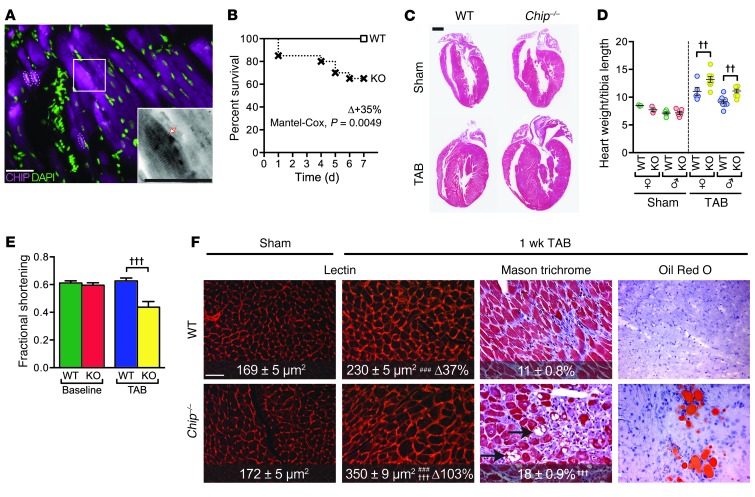
Figure 1. Pressure overload-induced cardiac hypertrophy in Chip–/– mice.
(A) Indirect immunofluorescence images of CHIP expression (magenta) and nuclei (green) in mouse heart. The arrow indicates sarcomere localization; dashed areas indicate nuclear localization (white). Scale bar: 50 μm. (B) Survival curves after TAB surgery in wild-type or Chip–/– mice (n = 12 and 20, respectively). (C) Hematoxylin and eosin–stained whole heart sections from the indicated conditions. Scale bar: 1 mm. (D) Heart weight normalized to tibia length (mg/mm; n = 3 and 6 male and female wild-type sham mice, respectively; n = 5 and 8 male and female wild-type TAB mice, respectively; n = 3 and 5 male and female Chip–/– sham mice, respectively; n = 8 male and female Chip–/– TAB mice, respectively; P < 0.01 across all sexes and genotypes, sham vs. TAB; ††P < 0.01 sex-matched wild-type vs. Chip–/– mice). (E) Fractional shortening (%) after sham or TAB surgery (n = 6 and 7 for sham and 8 and 6 for TAB in wild-type and Chip–/– mice, respectively; †††P < 0.001 vs. all other groups). (F) Representative histological staining of whole heart sections from wild-type and Chip–/– mice. Lectin images represent 25 areas from 4 mice per condition. In Masson trichrome images, numbers represent percentage interstitial fibrosis (n = 13). ###P < 0.001 TAB vs. sham; †††P < 0.001 wild-type vs. Chip–/–. Arrows indicate intercellular and intracellular regions void of tissue. Scale bar: 100 μm.

