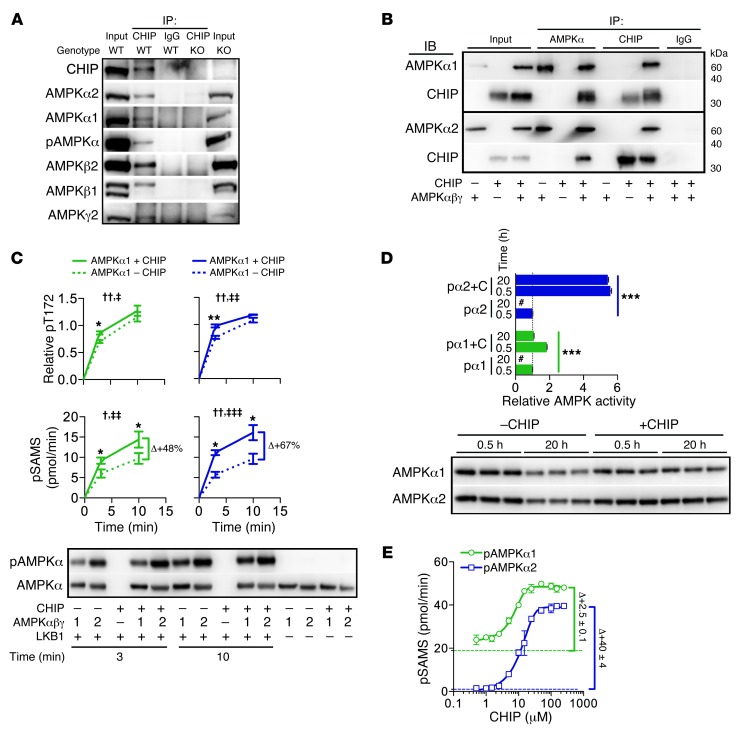
Figure 4. Analysis of the CHIP-AMPK interaction.
(A) Immunoblot analysis from CHIP or control (IgG) immunoprecipitations in wild-type and Chip–/– heart lysates. (B) Immunoprecipitations of reactions containing recombinant CHIP, AMPKα1β1γ1, AMPKα2β1γ1, or combined proteins, subsequently immunoblotted with the indicated antibodies. (C) Densitometry of AMPKα-T172 phosphorylation (pT172) and AMPK activity measured by SAMS phosphorylation (pSAMS) in reactions containing combinations of proteins as indicated. Relative pT172 was normalized to total AMPKα. Data are represented by the mean ± SEM from 3 independent experiments (2-way ANOVA, †P < 0.05, ††P < 0.01,comparing time; ‡P < 0.05, ‡‡P < 0.01, and ‡‡‡P < 0.0001, comparing the presence of CHIP; t test, *P < 0.05 and **P < 0.01, comparing the presence of CHIP per time point). (D) Activated pAMPKα1β1γ1 (pα1, green) and pAMPKα2β1γ1 (pα2, blue) activity in the absence or presence of CHIP (+C) measured by SAMS phosphorylation (represented by mean ± SEM from 3 independent experiments) (ANOVA post-hoc test, ***P < 0.001 comparing all pairs of conditions). Values were normalized to control conditions (0.5 hours in the absence of CHIP); “#” indicates activity measurements not significantly above background. The samples were also immunoblotted for total AMPKα1 or AMPKα2 from the indicated conditions. (E) AMPK activity measured by pSAMS (represented by mean ± SEM from 3 biological replicates) using reactions containing either activated pAMPKα1β1γ1 (green) or pAMPKα2β1γ1 (blue) mixed with increasing amounts of recombinant CHIP. Dashed green and blue lines represent baseline activities of pα1β1γ1 and pα2β1γ1, respectively.

