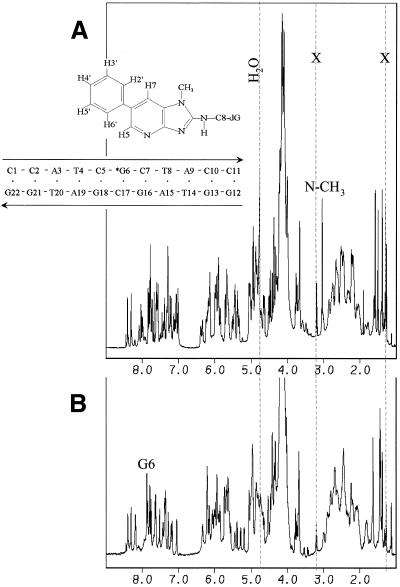
Figure 6.
Proton one-dimensional NMR spectra of the C8-dG-PhIP-11mer duplex adduct (A) and control 11mer duplex (B). The residual H2O signal is shown and resonances due to the presence of acetate from DNA purification are indicated with an X. The positions of the G6(H8) proton in the spectrum of the control 11mer duplex (A) and the PhIP(N-CH3) group in the spectrum of the 11mer duplex adduct are also indicated.

