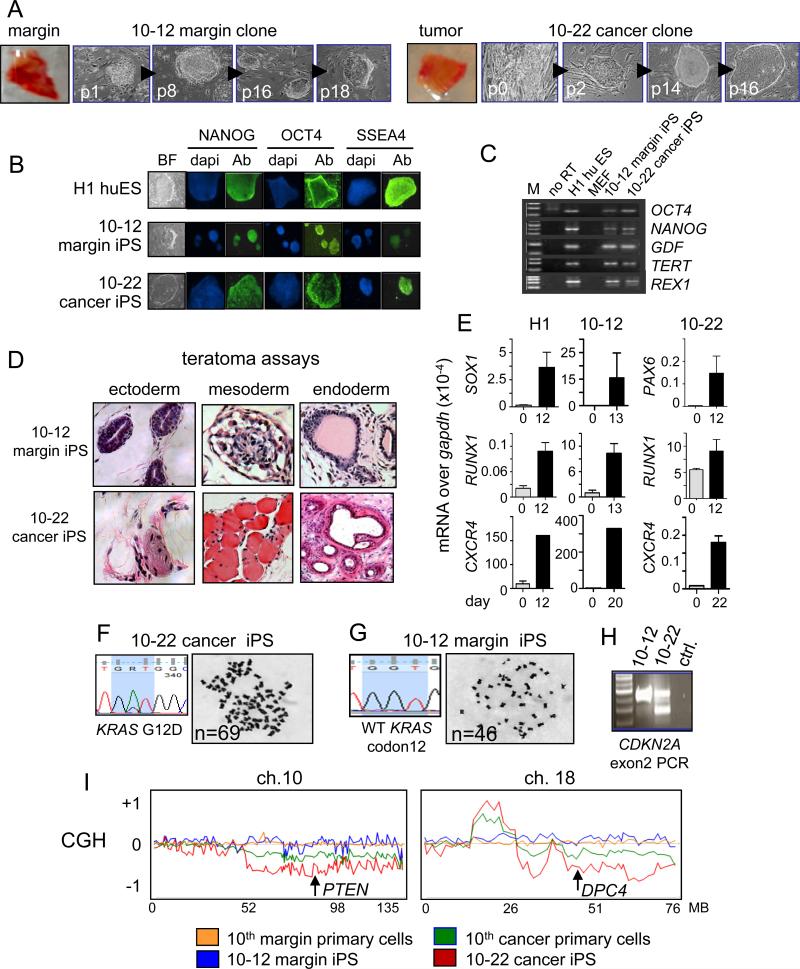
Figure 1. Establishing iPS-like lines from patient-matched margin and pancreatic ductal adenocarcinoma.
A. Cells from pancreatic cancer and margin tissues were reprogrammed and different passages of the 10-12 margin and 10-22 cancer iPS-like clones from patient #10 are shown. B, C. Expression of pluripotency markers in 10-12 margin and 10-22 cancer iPS-like lines by immunostaining (B) and RT-PCR (C). D. Three month teratomas in NSG mice from 10-12 margin and 10-22 cancer iPS-like lines showed differentiation into tissues of all three germ layer lineages (also see Figure S2A). E. Expression of differentiation markers for endoderm (CXCR4), mesoderm (RUNX1), and ectoderm (SOX1, PAX6) relative to GAPDH in embryoid bodies from H1 huES cells and 10-12 margin and 10-22 cancer iPS-like lines cultured for 12-14 days. Error bars, mean ± SD. F, G. DNA sequence tracks revealing KRAS mutation and karyotype showing subtetraploidy in the 10-22 cancer iPS-like line (F) and wild type KRAS and normal karyotype in the 10-12 margin iPS-like line (G). H. PCR analysis of CDKN2A (p16Ink4a) exon 2 reveals a heterozygous deletion in 10-22 cells. I. Comparative genomic hybridization showing normal profiles for the 10th primary margin cells (orange) and the 10-12 margin iPS-like line (blue). Gross chromosomal rearrangements are evident in the 10th primary cancer cell culture (green), which was mixed with normal stromal cells; the rearrangements are evident more clearly in the 10-22 cancer iPS-like line (red) (also see Figure S3B), demonstrating that the 10-22 line is clonally derived representative of the initial tumor epithelial cell population. The locations of PTEN and DPC4 (SMAD4) loci are shown in regions of chromosome loss in the 10th cancer and 10-22 cells.

