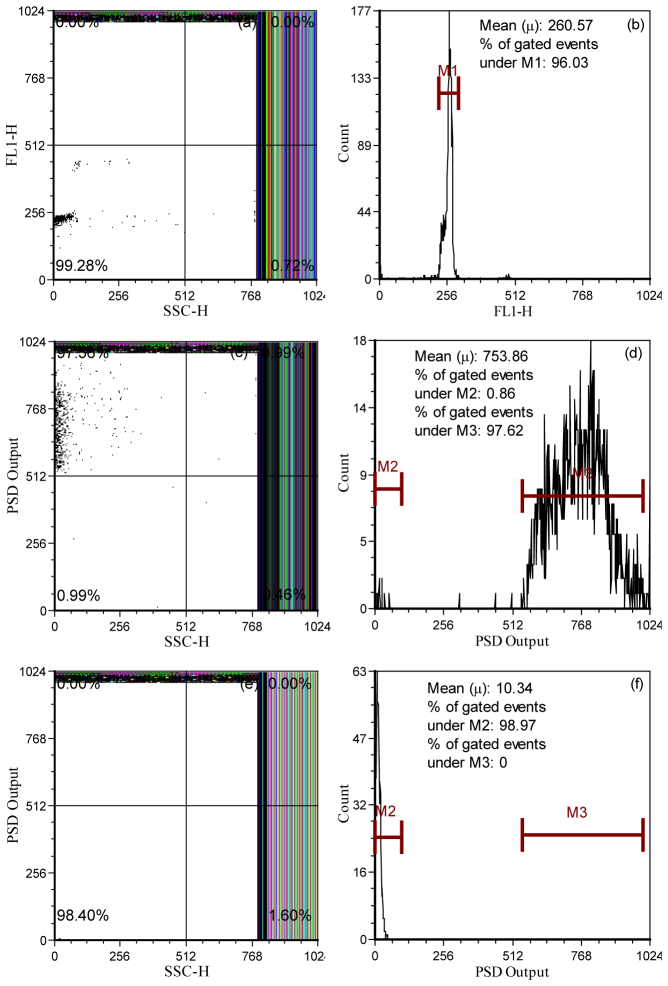
Fig. 5.
Histograms and dot plots representing the number of Flow-Check fluorospheres having a specific side-scatter intensity (SSC), fluorescence intensity (FL1-H), or phase-sensitive intensity (PSD) signal before and after the phase-filtering process. Panels (a) and (b) present typical scatter and fluorescence histograms to illustrate the presence and detectability of the fluorospheres on the PFCS system. Panels (c) and (d) are the PSD fluorescence intensity counts measured by the same cytometer after phase filtering to maximize the fluorosphere signal (i.e. ). The dot plot shows the signal correlated to side scatter (SSC). Panels (e) and (f) are the PSD fluorescence intensity counts measured by the same cytometer after phase filtering to eliminate the fluorosphere signal (i.e. ).

