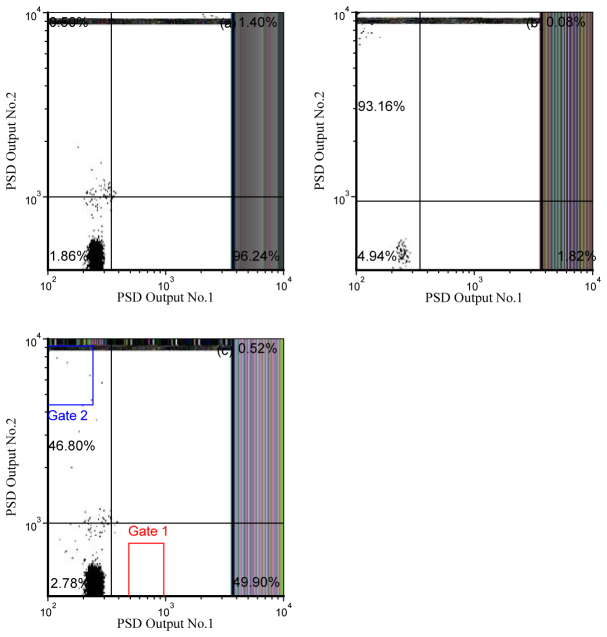
Fig. 6.
Dot plots of phase-resolved detection prior to sorting. The parameters plotted are PSD No.1 vs. PSD No.2 (see Fig. 1). In panels (a) and (b) Flow-Check fluorospheres and YG microspheres are measured separately with the PFCS system. Panel (a): PSD No.1 is used to null YG fluorescence so that only fluorescence from Flow-Check fluorospheres is detectable; this demonstrates that the Flow-Check fluorosphere signals remain. Panel (b): PSD No.2 is adjusted to null Flow-Check fluorospheres so only signals from YG microspheres are detectable. Panel (c) is a dot plot of the phase-resolved detection of a mixed sample. Dots in gate 1 are Flow-Check fluorospheres and dots in gate 2 represent individual YG microspheres when the respective PSD channels are nulled to result in only one type of fluorescence signal per channel.

