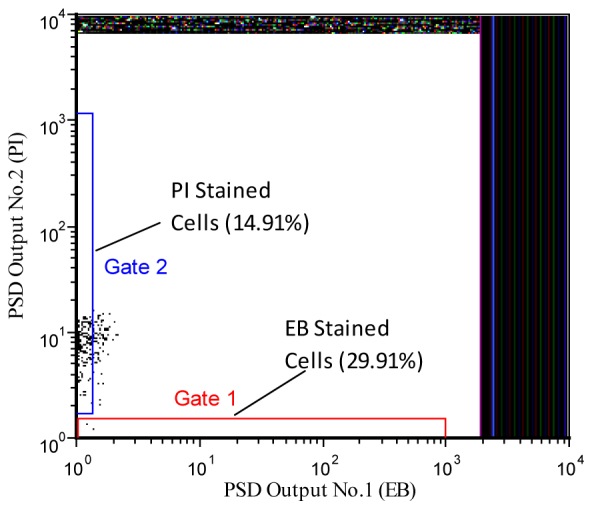
Fig. 8.

Dot plot of two correlated parameters, PSD No.1 vs PSD No.2 (see Fig. 1), for a mixture of EB and PI stained cells. The events show counts in the respective PSD channels where channel No.1 contains only signals from the EB-labeled cells and channel No.2 contains fluorescence signals from only PI-labeled cells. The plot was obtained after adjusting the respective PSD channels to null the signal from either the PI- or EB-stained samples. Therefore dots in Gate 01 are EB stained cells, which are approximately 29.91% of the total population, and dots in Gate 02 are approximately 14.91% of the total population.
