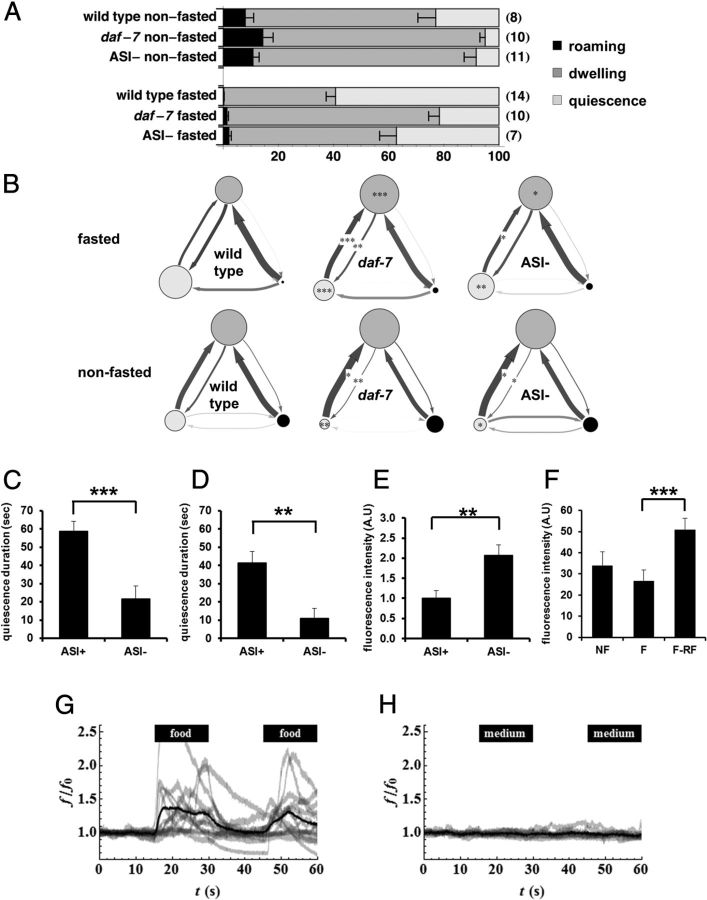
Figure 2.
TGFβ in ASI neurons promote the switch from dwelling to quiescence. A, Standard state probabilities (x-axis) of wild-type, daf-7 mutants and worms whose ASI neurons were genetically ablated by the recCaspase method (Chelur and Chalfie, 2007; Beverly et al., 2011) (ASI−). Numbers in the parenthesis are the sample size. Error bars are SEM. B, DAF-7 from ASI regulates transition rates from dwelling to quiescence. Transition rates among states of wild-type, daf-7 mutants, and worms whose ASI neurons were genetically ablated by the recCaspase method (Chelur and Chalfie, 2007; Beverly et al., 2011). Each diagram shows state probabilities and transition rates from one experiment after standard state fits. Each circle represents a state: light gray for quiescence, medium gray for dwelling, and black for roaming. The area of the circle is proportional to the probability of the state under those conditions. Each arrow represents a transition from one state to another. Thicker arrows represent higher transition rates. Darker arrows represent rates measured with high accuracy, paler arrows rates measured with poor accuracy. *p < 0.05, **p < 0.01, ***p < 0.001, by Mann–Whitney U test. C, Duration of satiety quiescence of mock operated worms (ASI+) and worms whose ASI neurons were killed with a laser (ASI−). Worms were fasted for 12 h and refed for 6 h then the quiescence durations were measured. n = 10 for each group per experiment, repeated three times. *p < 0.05, **p < 0.01, ***p < 0.001, by Student's t test. D, Duration of satiety quiescence of worms whose ASI neurons were genetically ablated by the recCaspase method (Chelur and Chalfie, 2007; Beverly et al., 2011). ASI− worms showed reduced satiety quiescence. n = 10 for each group per experiment, repeated three times. **p < 0.01, by Student's t test. E, Worms with ASI genetically ablated ate more than worms with intact ASI when food intake was measured with mCherry-expressing E. coli after 3 h of refeeding followed by 12 h of starvation. The ASI− worm had more fluorescence in the gut than ASI+, reflecting higher food intake. n = 10 for each group per experiment, repeated three times. **p < 0.01, by Student's t test. F, DAF-7 is upregulated after fasting and refeeding. We measured DAF-7 expression by quantifying fluorescence in the head of worms expressing DAF-7 fused to mCherry in worms not fasted (NF), fasted for 12 h (F), or fasted for 12 h and refed for 3 h (F-RF). n = 10 for each group per experiment, repeated four times. The graphs show the average of all experiments. ***p < 0.001, Kruskal-Wallis ANOVA (***p < 0.001) followed by Mann–Whitney U test. G–H, Ca2+ imaging from ASI neurons. One or both ASIs were imaged as either control or an experimental stimulus flowed past the tip of the head, where the ASI sensory endings are located. The stimulus, either E. coli HB101 in minimal medium (G) or minimal medium alone (H), was presented from 15 to 30 s and again from 45 to 60 s. Individual traces, normalized so that the mean for the first 15 s (before presentation of stimulus) is 1, are shown in light gray (f is fluorescence, f0 baseline fluorescence; the ratio is f/f0). The dark black line is the mean of the normalized traces. n = 14 for stimulus, n = 10 for control.

