
Figure 2.
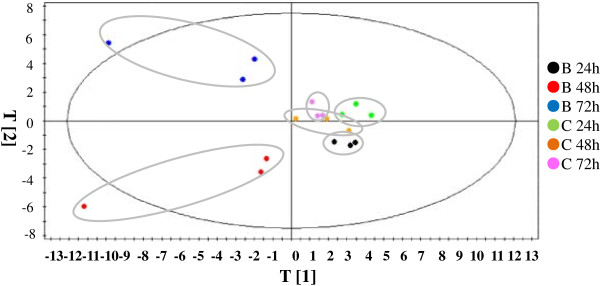
PCA score plot of metabolomic profiles of Synechocystis along the treatment time course. Samples with or without butanol treatments were indicated by different colors. The biological replicates were circled for the same conditions.
Official websites use .gov
A
.gov website belongs to an official
government organization in the United States.
Secure .gov websites use HTTPS
A lock (
) or https:// means you've safely
connected to the .gov website. Share sensitive
information only on official, secure websites.
PCA score plot of metabolomic profiles of Synechocystis along the treatment time course. Samples with or without butanol treatments were indicated by different colors. The biological replicates were circled for the same conditions.