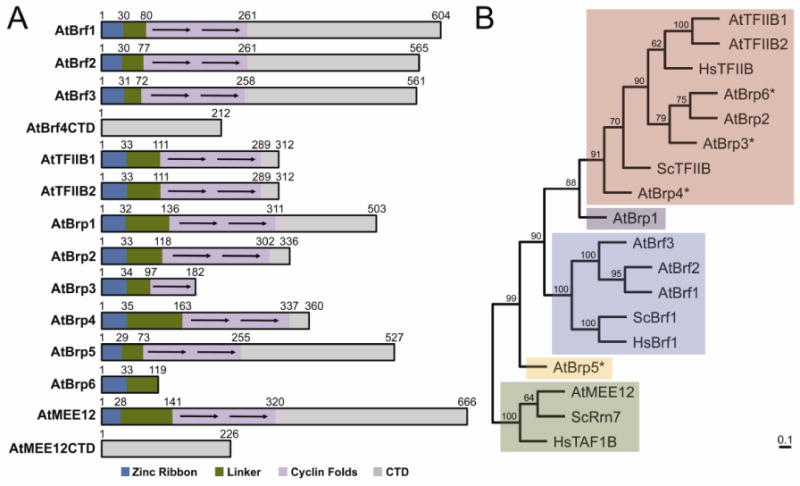
Figure 2. Domain architecture and phylogenetic relationships of A. thaliana TFB family proteins.

(A) Schematic representation of TFB family protein domain architecture. Each domain is represented by a different color. Arrows indicate individual cyclin fold repeats. (B) Evolutionary relationship of A. thaliana TFB-like proteins. The phylogenetic tree was created by comparing the TFIIB Homology Domain (BHD) domain that consists of the zinc ribbon, linker, and cyclin fold domains for each TFB-like protein. AtBrf4CTD and AtMEE12CTD were excluded from this analysis since neither proteins contain a BHD. Each clade is shaded a different color based on their closest evolutionary relationship. The numbers at each node represent the percentage of trees supporting the specific branching pattern in the bootstrap analysis. The scale bar represents the number of estimated changes per position for a unit of branch length.
