
Figure 3.
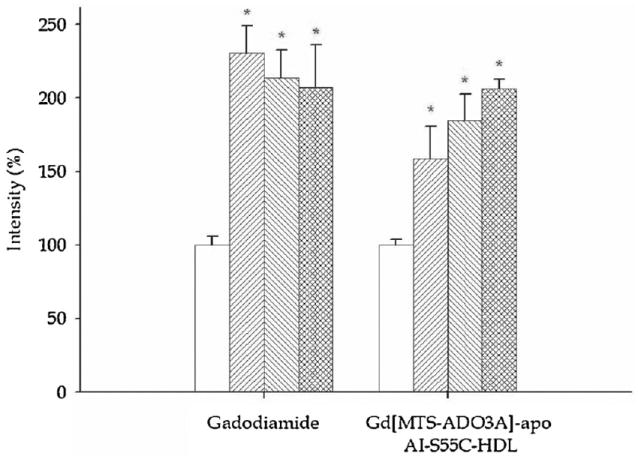
Bar graphs of image intensity in kidney medulla in the control period (prior to the injection of contrast agent) (□) and 5 min (▦), 10 min (▨) and 30 min (▥) after the infusion of gadodiamide and Gd[MTS-ADO3A]apo AI-S55C.
Official websites use .gov
A
.gov website belongs to an official
government organization in the United States.
Secure .gov websites use HTTPS
A lock (
) or https:// means you've safely
connected to the .gov website. Share sensitive
information only on official, secure websites.
Bar graphs of image intensity in kidney medulla in the control period (prior to the injection of contrast agent) (□) and 5 min (▦), 10 min (▨) and 30 min (▥) after the infusion of gadodiamide and Gd[MTS-ADO3A]apo AI-S55C.