
Figure 5.
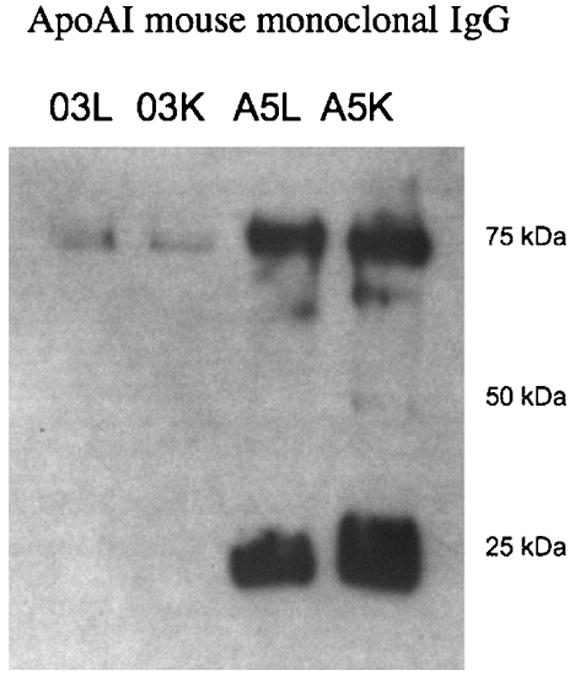
Western blot of extracts from the control period (prior to the injection of contrast agent) and from liver and kidney infused with gadodiamide (lanes 03L and 03K, respectively) and Gd[MTS-ADO3A]apo AI-S55C (lanes A5L and A5K, respectively). The 25- and 75-kDa bands in lanes A5L and A5K correspond to monomeric and oligomeric apolipoprotein AI.