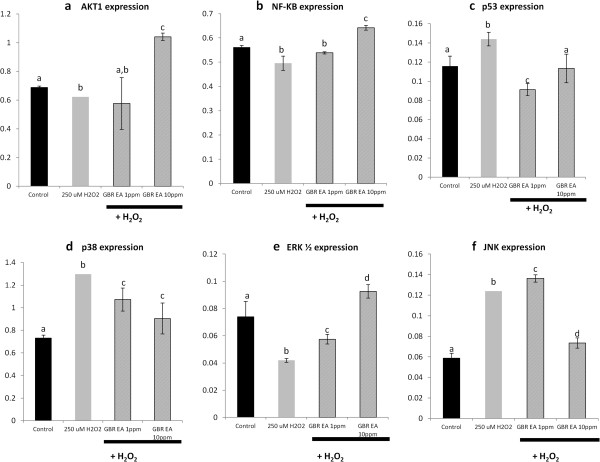
Figure 5.
Expression of AKT, NF-Kβ, p53, p38 MAPK, ERK1/2 and JNK genes in SH-SY5Y cells. mRNA levels of (a) the AKT, (b) the NF-Kβ, (c) the p53, (d) the p38 MAPK, (e) the ERK1/2, and (f) the JNK genes following treatment with 1 and 10 ppm of GBR extract and subsequent treatment with 250 μM H2O2, in comparison to untreated and 250 μM H2O2-treated controls. Bars represent means of groups (n=3) and error bars represent SDs. Different letters on any 2 bars representing each gene indicate statistically significant difference (p < 0.05) between the groups.

