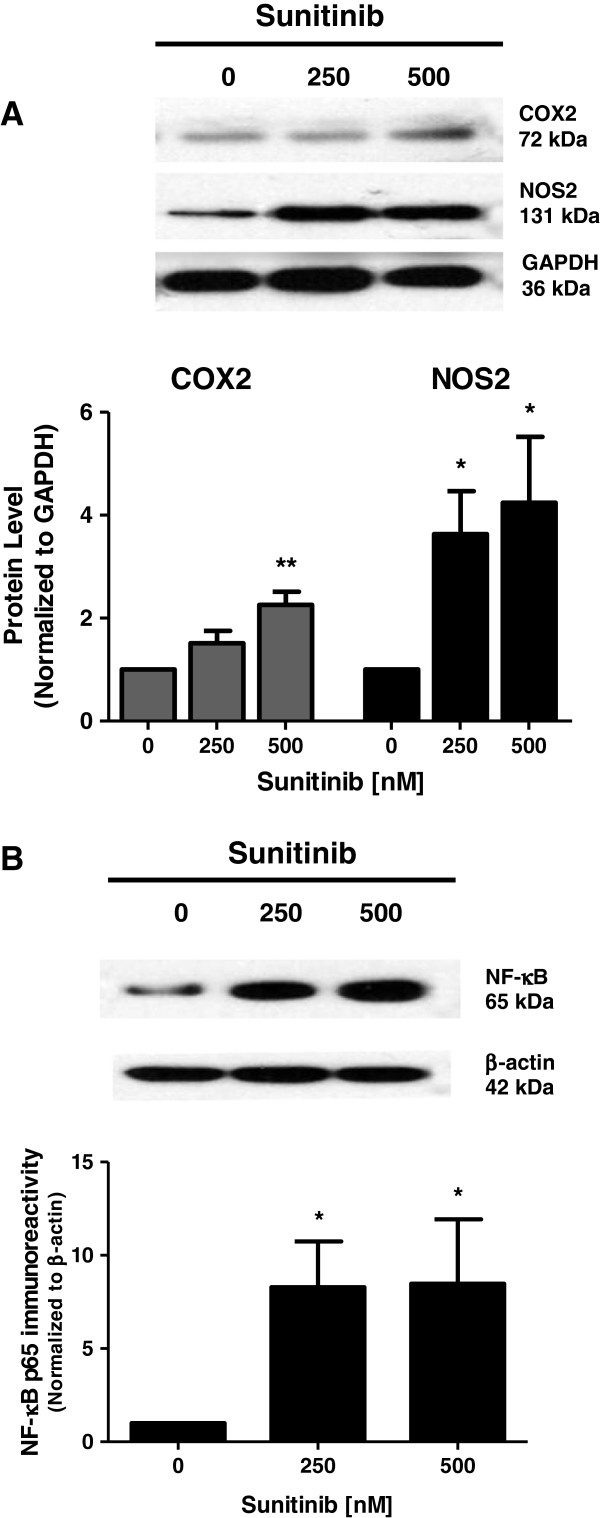
Figure 2.
Expression of COX2, NOS2 and NF-κB in neurons treated with sunitinib. Neuronal cultures were exposed to increasing dose of sunitinib for 24 h and western blot analysis was used to determine the levels of (A) COX2 and NOS2, and (B) NF-κB. Data are mean ± SEM from four experiments. *P < 0.05, **P < 0.01 vs. corresponding control. SEM, standard error of the mean.

