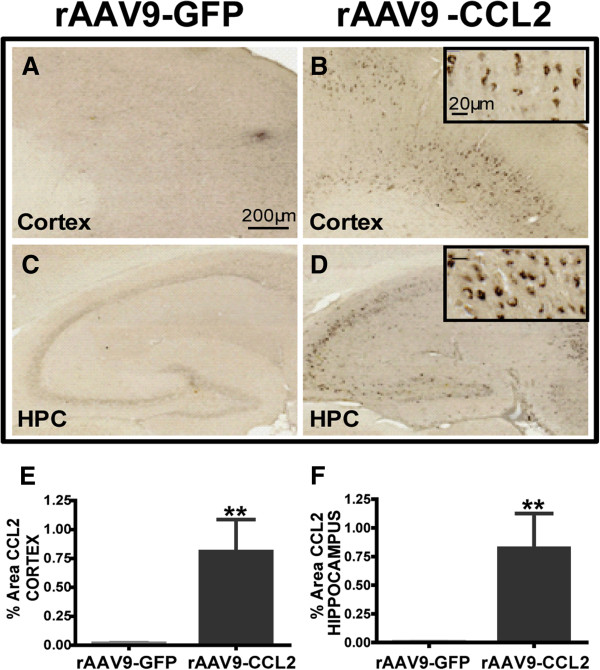
Figure 2.
CCL2 distribution and expression in the brain. Immunohistochemical staining for CCL2 was performed. (A) through (D) Overall distribution of CCL2 in the brains of animals injected with rAAV9-GFP and rAAV9-CCL2. Photomicrographs represent the expression of CCL2 in the ipsilateral (injected) hemisphere in GFP control (A) and (C) and CCL2 animals (B) and (D). Higher magnification shows neuronal localization of CCL2 expression (insets). (E) and (F) present the means ± SEM of percentage positive area of immunostaining for CCL2 in the cortex and hippocampus, respectively. Scale bar represents 200 μm (20 μm for insets). Statistical analyses were performed using Student's t-test (**P < 0.01, n = 6 per group).

