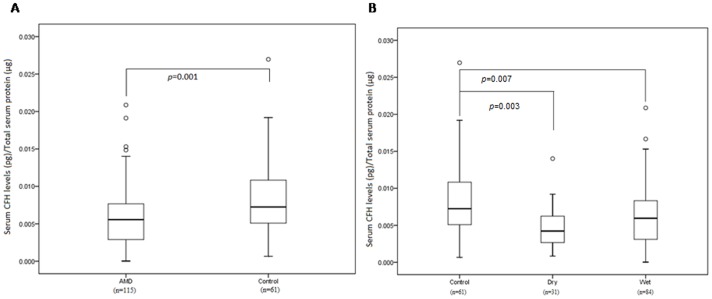
Figure 1. A) Serum levels of CFH in AMD and normal controls.
B) Serum levels of CFH in Controls, Dry and Wet AMD. Boxes include values from first quartile (25th percentile) to third quartile (75th percentile). Outliers and extreme values are shown in circles and asterisk respectively. Levels of CFH were standardized to total protein. AMD, Age Related Macular Degeneration; CFH, Complement Factor H; pg, picogram; µg, microgram.

