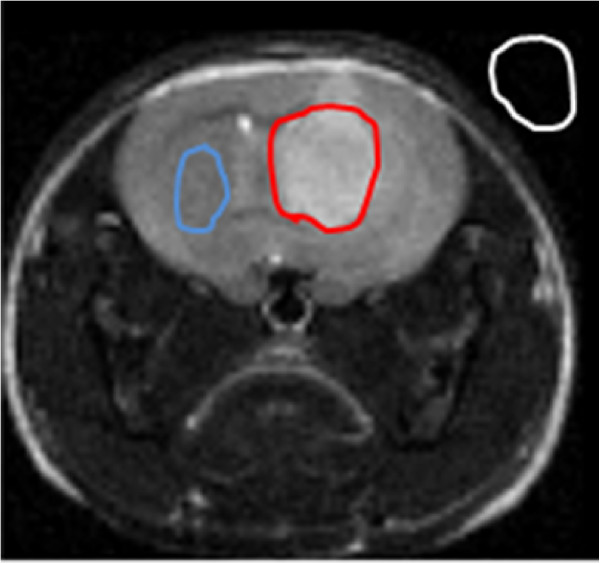
Figure 2.

A method of calculating CNR using ROIs. SI(t) and SI(b) are the averaged signal intensities within the tumor (red line) and a normal brain (blue line) region respectively; Noise was measured outside the mouse head (white line). ROIs were selected using pre-contrast SE pulse sequence.
