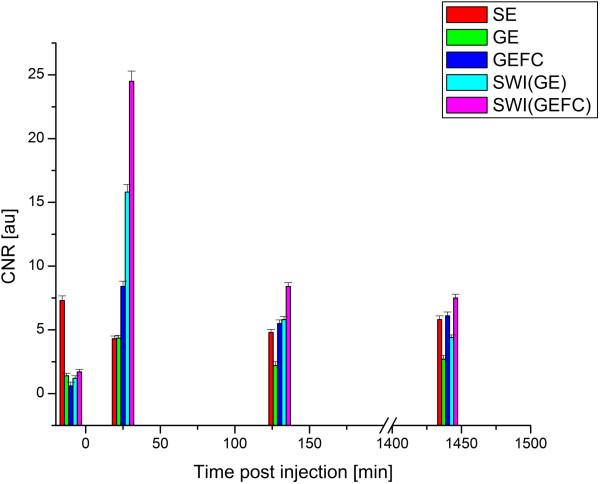
Figure 4.
Absolute CNR values for SE, GE, GEFC obtained prior, 20/30/31, 120/130/131 and 1440/1450/1451 min (~24 hrs) post intravenous tail contrast injection respectively. SWI obtained from GE and GEFC data are also shown for comparison. Note the two-fold increase in CNR with the GEFC pulse sequence and even larger increase for SWI after injection of the targeted NP. (The sequence durations are not to scale for clarity.)

