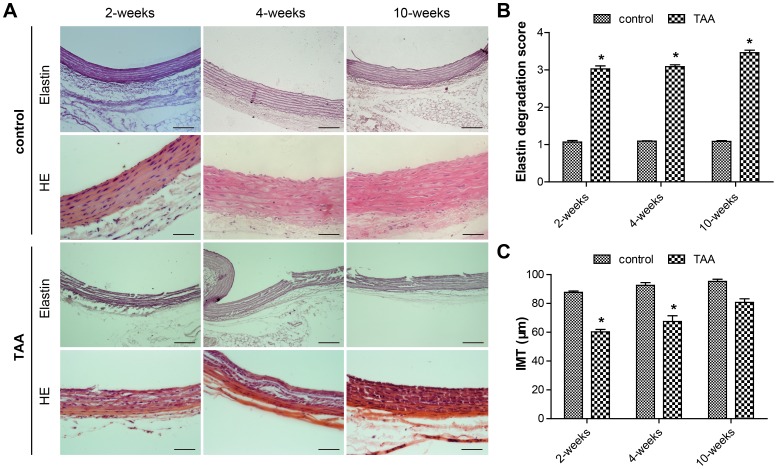
Figure 2. Disruption of the elastic lamellar structure at all time-points after thoracic aortic aneurysm induction.
A, Representative Weigert staining and hematoxylin/eosin staining of sections of the aorta from NaCl-treated and TAA-induced rats. Scale bar = 100 µm. B, Grading of elastin degradation at each time-point in the two groups. C, Quantitation of intima-media thickness (IMT) in the two groups. Bars represent the SEM, *P<0.05 compared with the control group (n = 6 for each group).

