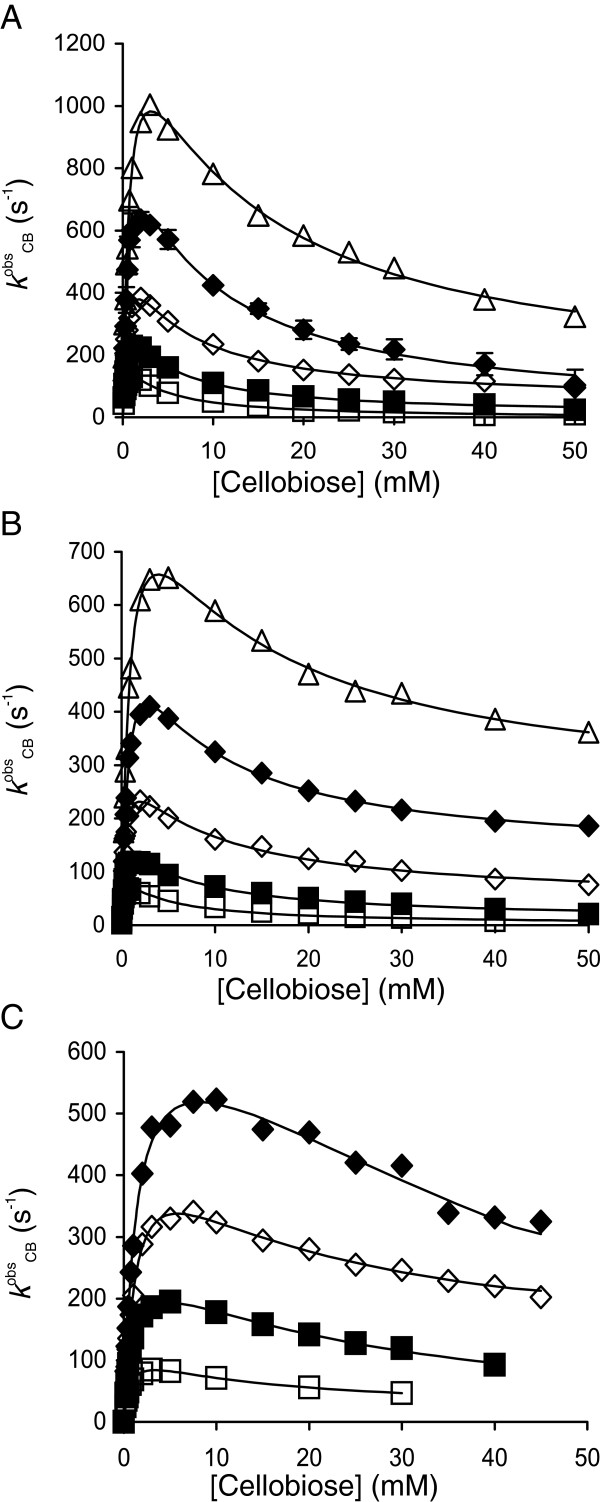
Figure 2.
Hydrolysis of cellobiose at different temperatures. Observed rate constants for the turnover of cellobiose (kobsCB) at 25°C (□), 35°C (■), 45°C (◊), 55°C (♦) and 65°C (∆). β-glucosidases included (A)TaBG3, (B)AtBG3 and (C)N188BG. The solid lines are from the non-linear regression according to Equation 2.

