
Figure 3.
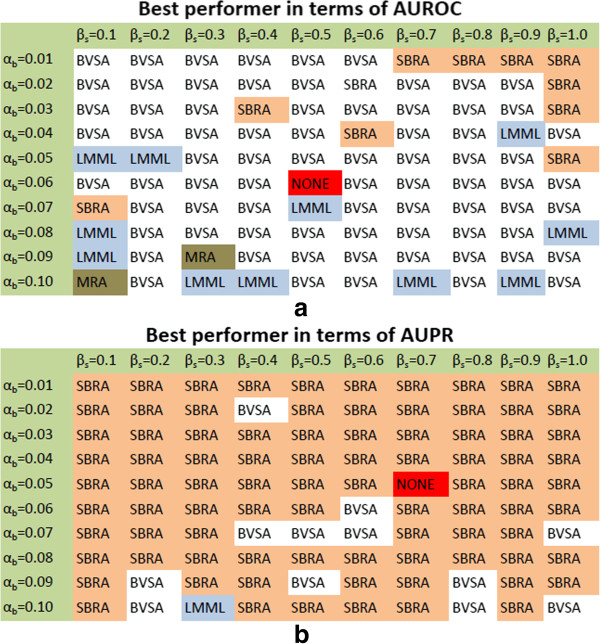
Best performers in reconstructing the the MAPK pathway at different levels of signal dependent and independent noises. The performances were evaluated for different levels of signal dependent (βs, X-axis) and independent (αb, Y-axis) components of the measurement errors. βs and αb were gradually increased from a minimum of 0.1 up to 1 and from 0.01 up to 0.1 respectively. The best performers in terms of maximum average AUROC(p<0.05)and maximum average AUPR(p<0.05) are shown in panels (a) and (b) respectively.