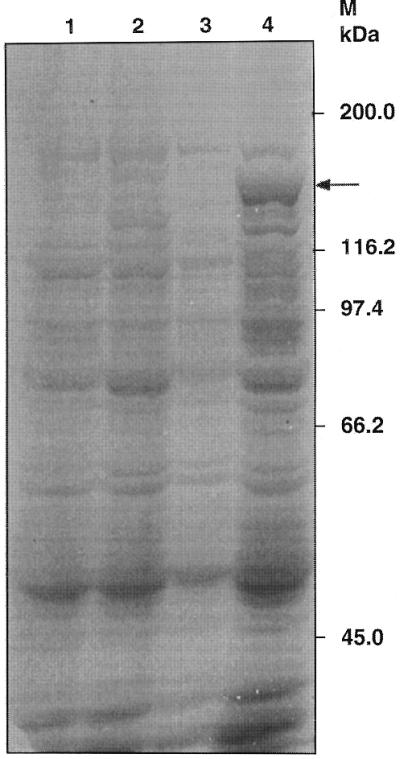
Figure 4.

Coomassie-stained SDS–PAGE showing the overexpression of full-length LdTOP2 protein in E.coli. The pET3a bacterial extract is shown, before induction (lane 1) and after induction (lane 2) with 0.5 mM IPTG. Lanes 3 and 4 show the uninduced and induced extracts of pET3a–LdTOP2, respectively. Arrow shows the induced recombinant LdTOP2 protein. The sizes of the broad range protein MW markers (Bio-Rad) are shown on the right.
