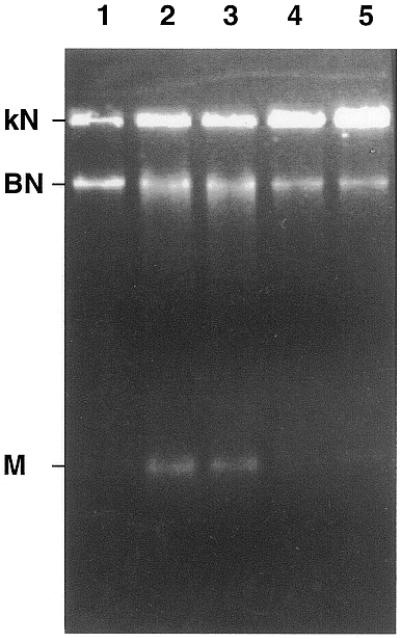
Figure 5.

Biochemical characterisation of the bacterially expressed LdTOP2 protein: in vitro decatenation activity and its inhibition by etoposide. Lane 1, 1 µg of kDNA network; lanes 2 and 3, incubation of 1 µg of kDNA with 0.1 and 0.2 µl of induced pET3a–LdTOP2 crude extract in the decatenating mixture containing 2 mM ATP; lanes 4 and 5, same as lanes 2 and 3, respectively, but in the presence of 20 µg/ml of etoposide. kN, kDNA network; BN, broken network; M, released minicircles.
