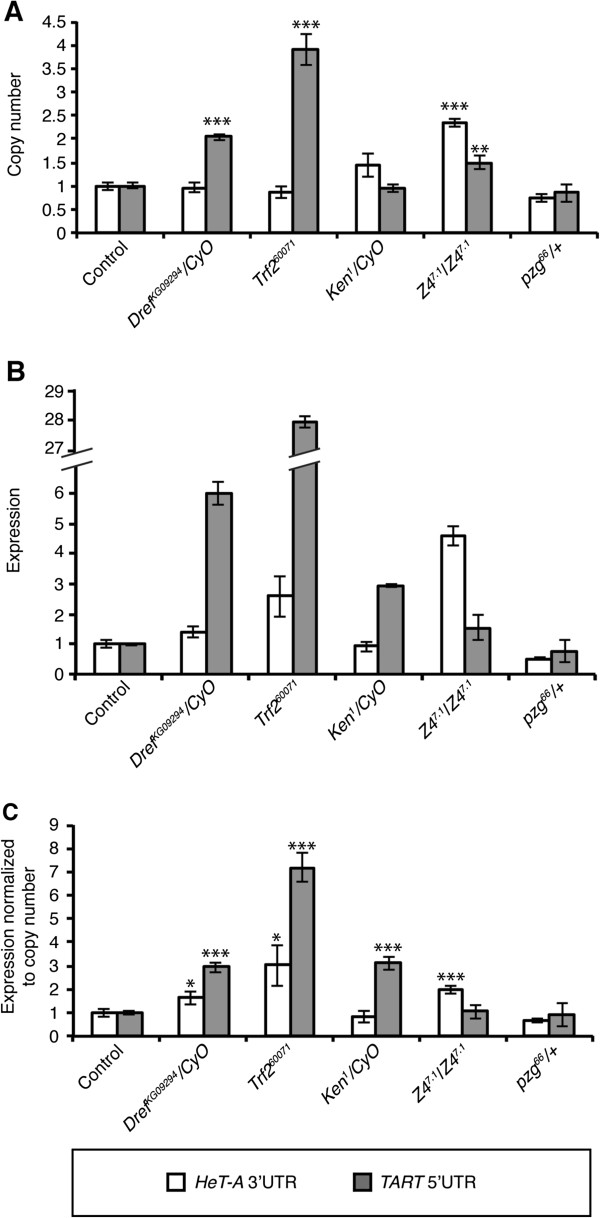
Figure 1.
HeT-A and TART expression and copy number in Dref, Trf2, Ken, and pzg mutants. (A)Dref and Trf2 mutants have more TART copies than control flies but no difference in HeT-A copies is observed. Ken and pzg66/+ mutants do not affect HeT-A or TART copy number. Z47.1/Z47.1 mutants have more HeT-A and TART copies. (B,C)HeT-A transcripts increase in Dref, Trf2, and Z47.1/Z47.1 mutants but no effect is observed in Ken mutants. TART transcripts increase in Dref, Trf2, and Ken mutants and do not change in pzg mutants. HeT-A is represented in white bars and TART in grey bars. Error bars represent standard deviations of three independent experiments. Asterisks indicate statistically significant differences (* P < 0.05 to 0.01; ** P < 0.01 to 0.001; ***, P < 0.001) in HeT-A and TART expression and copy number of each mutant compared with respective controls. For all the analyzed stocks, the number of copies and level of expression were normalized to their respective controls, w1118 and ry506, which in turn were normalized to 1, to simplify the interpretation of the data.

