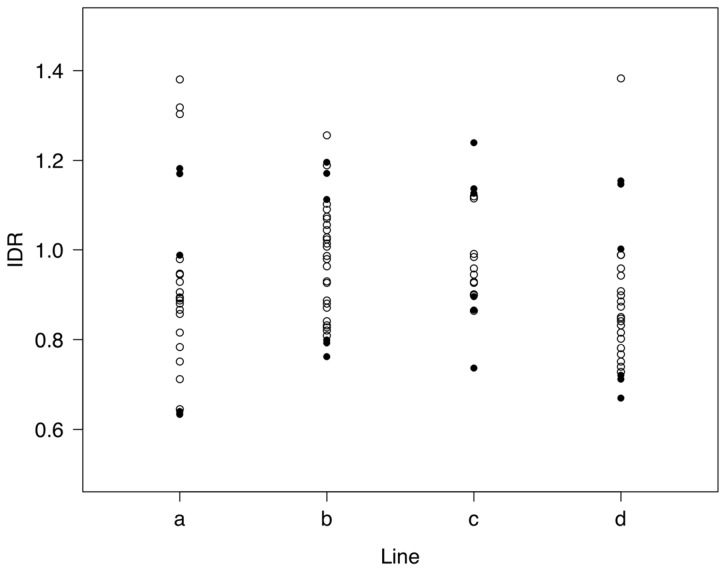
Figure 2. Inbreeding depression rate for productivity (IDR).
IDR expressed in % per 1% increase in inbreeding coefficient for each of the sublines of the four inbred lines (a, b, c, d) at generation 8. The three sublines with the largest (provided enough individuals were available for analysis) and the lowest inbreeding depression in each inbred line chosen for expression analysis are shown with black symbols.

