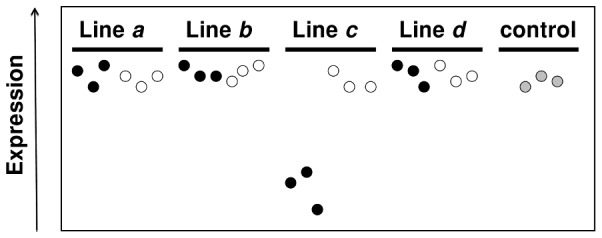
Figure 3. Schematic representation of the rationale behind the detection of single line–level of depression (SL-LD) outliers.

The three most depressed sublines of line c are assumed to have a level of gene expression substantially lower than that from all other samples. This would be consistent with the existence of line-specific genetic alterations affecting both fitness and gene expression.
