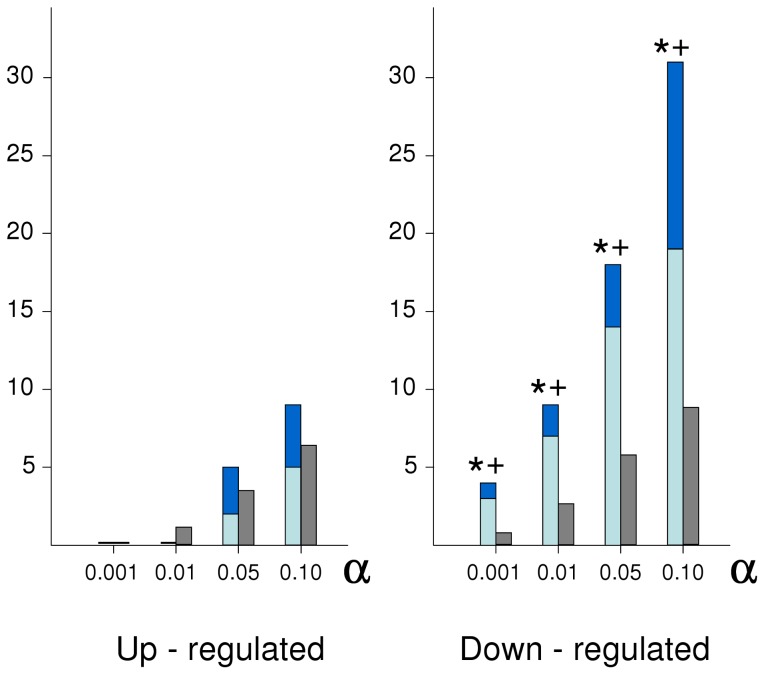
Figure 4. Analysis of probe sets having two outlier sublines in the same direction.
We show the observed numbers of SL-LD outliers (dark and light blue, least and most depressed sublines, respectively), and the corresponding expected numbers (grey) after randomizing the line and depression level of the probe sets showing two up-regulated and two down-regulated outliers, respectively. Results are shown for decreasing α (probability of significance) values in the Grubb’s test to detect extreme expressions restricted to two sublines. The expected SL-LD numbers are not separated into least and most depressed sublines because their expected frequencies are equal after the randomization of line and depression level codes. *, P<0.05 in a randomization test (n = 10000) comparing observed and expected numbers; +, P<0.05 in tests comparing the whole expected number in each class with that observed in the most depressed sublines only.

