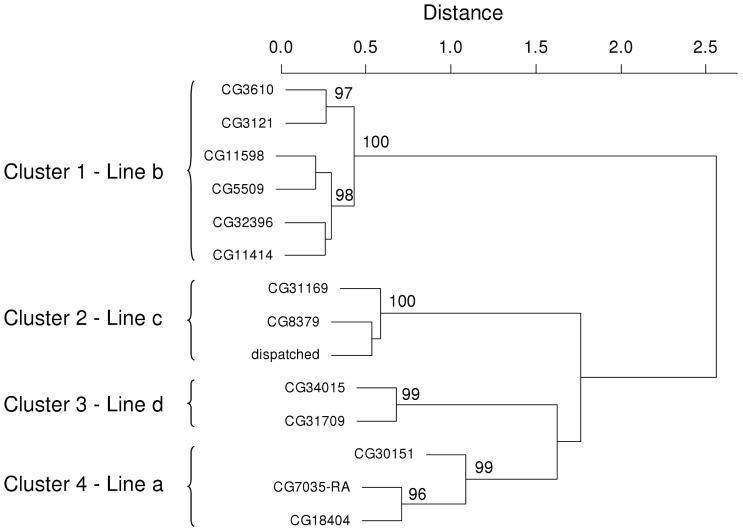
Figure 5. Hierarchical clustering of the 14 genes candidates to be sources of inbreeding depression.
R [55] hclust function using “complete distance” as clustering method and absolute correlations as distance measure. The numbers in cluster splits are “approximately unbiased p-values” calculated by multiscale bootstrap resampling (1000 replications) using the pvclust function from the pvclust R package [56]. Only p-values higher than 95% are shown.

