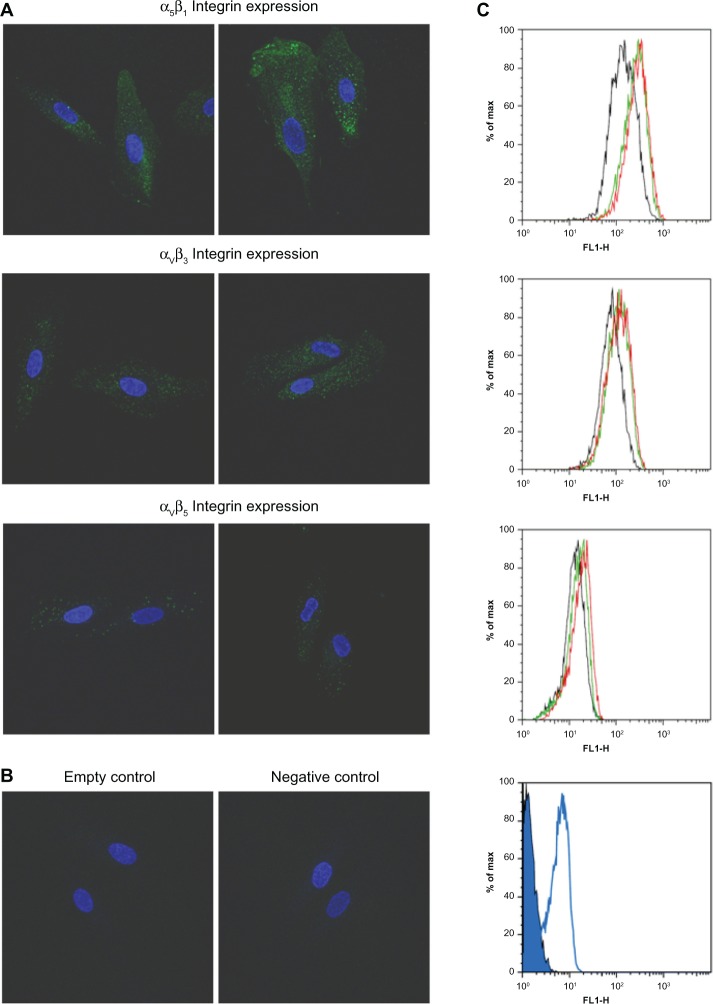
Figure 8.
Induction of integrin expression in ARPE-19 cells. Surface expression of integrin was characterized in ARPE-19 cells after treatment of culture medium with or without epidermal growth factor for 24 hours. (A) Cell surface expression measured by confocal laser scanning microscopy using monoclonal antibodies against αvβ3, αvβ5, and α5β1 integrins. after treatment of culture medium without epidermal growth factor (left panel) or with 20 ng/ml of epidermal growth factor (right panel). ARPE-19 cells expressed all of these integrins at various levels. Integrin α5β1 was significantly induced by epidermal growth factor. (B) Empty and negative control groups were conducted for confirming the specific staining of integrin antibodies. (C) Intensity of cellular integrin expression measured by flow cytometry. After treatment with culture medium without epidermal growth factor (black histogram), culture medium with 2 ng/ml of epidermal growth factor (green histogram), or culture medium with 20 ng/ml of epidermal growth factor (red histogram). ARPE-19 cells expressed all of these integrins at various levels. Integrin α5β1 was induced most strongly by epidermal growth factor. Empty (closed blue histogram) and negative control group (open blue histogram) were also conducted.

