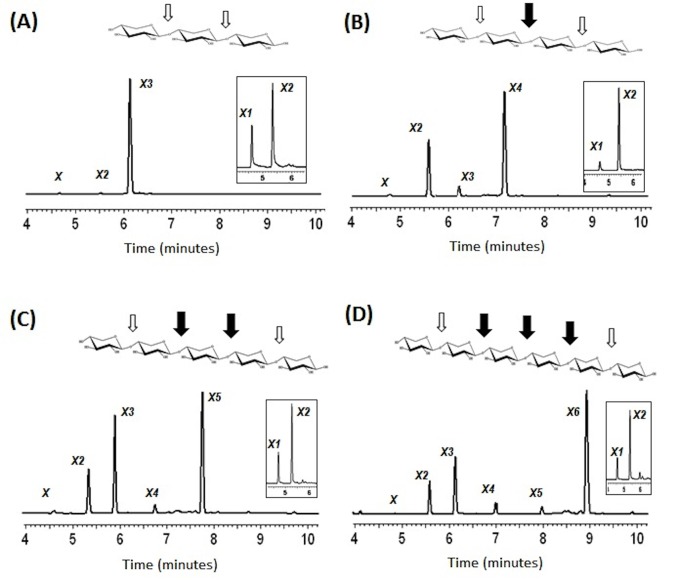
Figure 4. Analysis of the breakdown products released by SCXyl.
Xylotriose, xylotetraose, xylopentaose and xylohexaose degradation profiles are represented, respectively, (A), (B), (C) and (D). The intermediary products after 30 min of incubation are represented. The detached small boxes show the final degradation products, which were always xylose and xylobiose. The black and white arrows depict the preferential and the less preferential SCXyl cleavage site, respectively, based on the profile of intermediary products formed.

