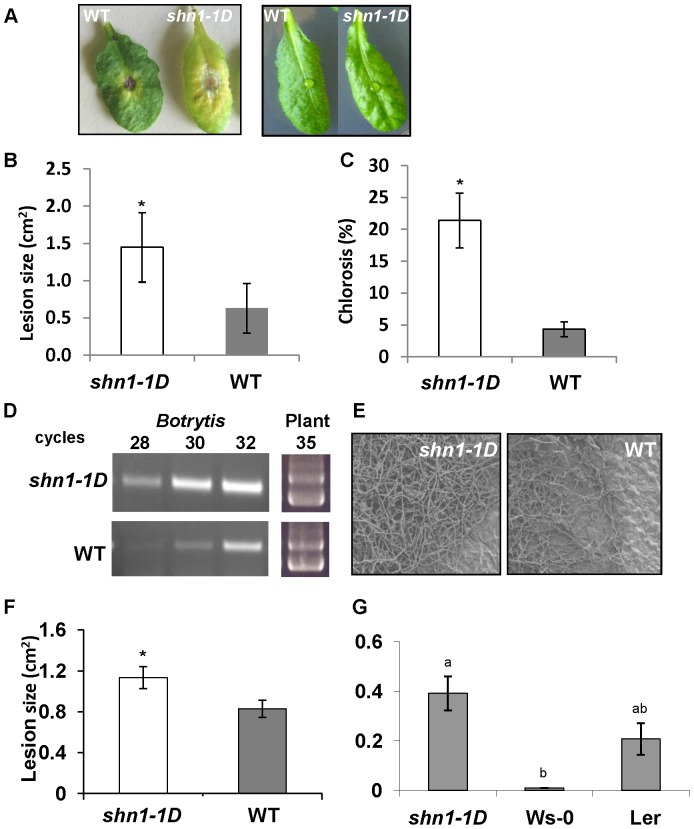
Figure 1. Disease symptoms on shn1-1D and WT leaves.
A, Infected leaves 72 h post-inoculation with B. cinerea (left) and mock-treated leaves (right). B, Expanding lesion size 72 h post-inoculation. C, Chlorosis percentage 72 h post-inoculation. Bars represent mean±SD of 15 leaves. Asterisks denote significant differences (P<0.05) as determined by Student’s t-test. D, Quantification of fungal DNA from infected leaves using semi-quantitative PCR with β-tubulin primers of B. cinerea and Arabidopsis as a control. E, SEM of shn1–1D and WT leaves demonstrating B. cinerea hyphal density 72 h post-inoculation. F, Expanding lesion size 48 h post-inoculation with S. sclerotiorum. G, Expanding lesion size 144 h post-inoculation with A. brassicicola. Bars represent mean±SD of 15–18 leaves. Asterisks denote significant differences (P<0.05) as determined by Student’s t-test, different letters denote significant differences (P<0.05) as determined by Kruskal-Wallis ANOVA, Dunn’s Method.

