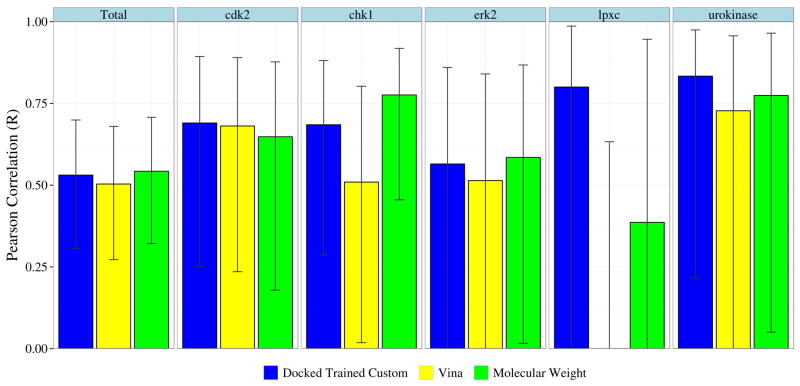
Figure 9.
Pearson correlation (R) of the docked-trained custom scoring function, the default Vina scoring function, and molecular weight with respect to experimental affinities. Error bars indicate the 95% confidence interval. The custom scoring function achieves better correlations and tighter confidence intervals than Vina. However, the difference is only statistically significant (p < 0.05) for lpxc. In this case, Vina predicts values that anti-correlate with the experimental values (R=−0.56). The crystal-trained scoring function achieved virtually identical correlations as the docked-trained function (not shown).

