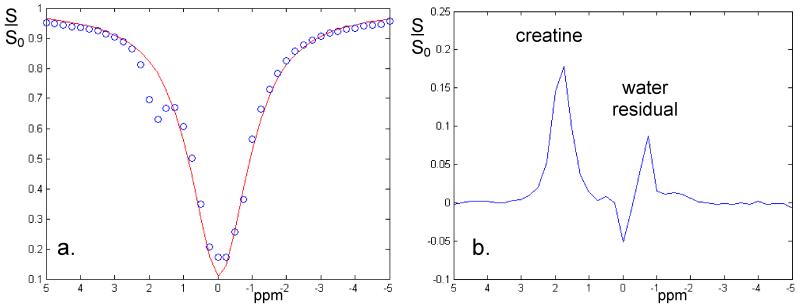
Figure 3.
CEST spectrum obtained from the creatine phantom (a). Using the 10 ms Gaussian-windowed one-lobe sinc 180 degree RF pulses in the saturation train with a sampling interval of 0.25 ppm clearly identifies a CEST effect at about 2 ppm offset from the water resonance (note that the temperature of water was 20 degrees less than in vivo, hence shifting the water resonance position by 0.2 ppm). Subtracting the CEST spectrum from a simple Lorentzian fit (b), normalized to the 1000 ppm offset irradiation data, the creatine peak is fully resolved, while a relatively small residual is observed from directly saturated water.

