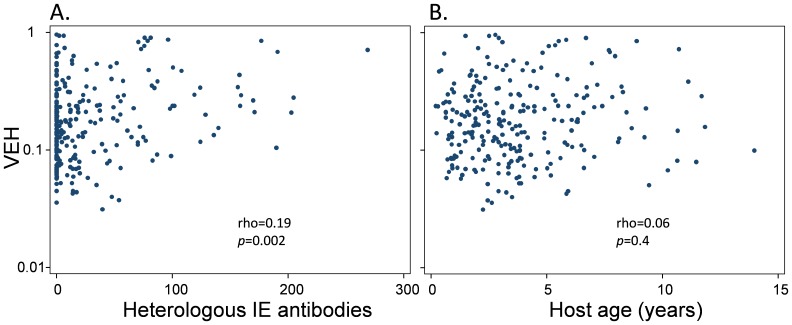
Figure 3. The relationship between VEH and host IE surface antibodies Scatter plots are shown of the relationship between VEH and the breadth of the heterologous IE surface antibody response (A, see legend to figure 2); (B) shows the relationship between VEH and host age.
Spearman’s rank correlation coefficient rho was used to test for correlation.

