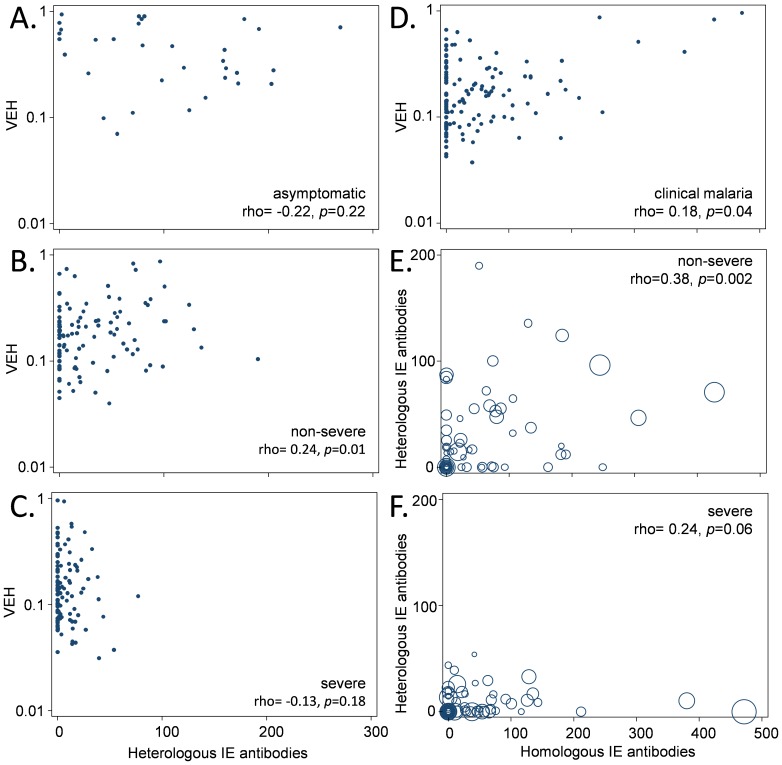
Figure 4. The relationship between VEH and host IE surface antibodies to heterologous and homologous isolates.
A-C show scatter plots of the relationship between VEH and breadth of the heterologous IE surface antibody response as in Figure 3A, but split into asymptomatic (A), non-severe (B) and severe malaria (C). (D) Shows the relationship between VEH and the homologous IE surface antibody response to each child’s own parasites among children with malaria (measured as mean fluorescence intensity). Among children shown in (D), (E-F) compares the heterologous and homologous responses among those with non-severe (E) and severe (F) malaria, respectively. The size of the marker in (E-F) is proportional to VEH. Spearman’s rho was used to test for correlation.

