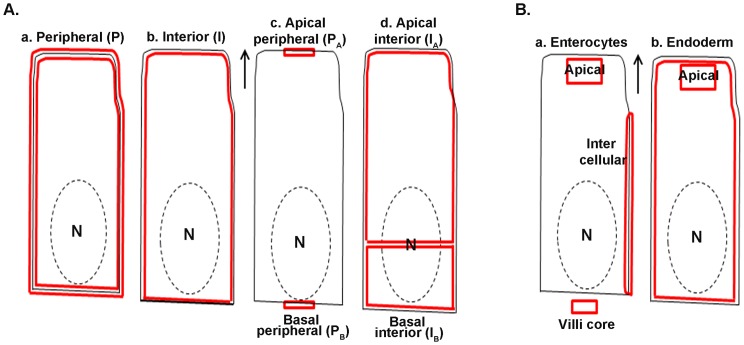
Figure 1. Cartoon of cells illustrating how regions of interest were drawn.
Solid black lines represent cell margins. Dashed black lines represent nucleus (N) border. Red lines denote regions of interest, either within or between the red lines. Arrows point toward lumen. Schemes for quantifying both FcRn (A) and IgG (B) are shown. Details are in text, in Quantitation Method of the Materials and Methods.

