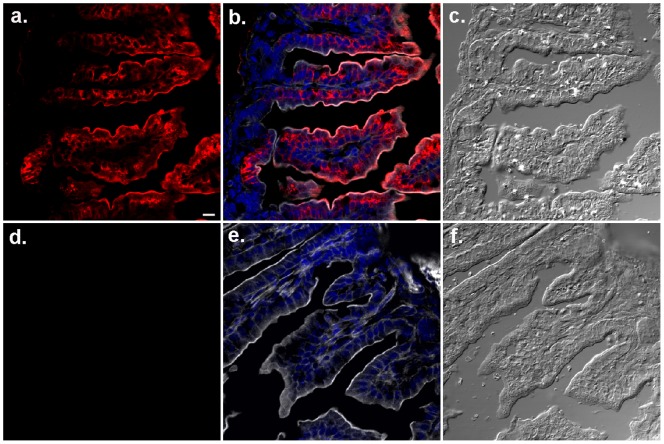
Figure 3. Specificity of hamster anti-mFcRn antibody in IF assay.
Photomicrographs illustrating gut sections from FcRn+/+ (a, b, c) and FcRn−/− (d, e, f) strain neonates labeled to visualize FcRn (red) with Armenian hamster anti-mouse FcRn antibody. The phalloidin (gray) and DAPI (blue) labeling were used to mark cell boundaries and nucleus, respectively, shown in b and e. For orientation DIC images in c and f are shown. The bar = 10 µm. See the complete lack of FcRn labeling in FcRn−/− tissues (d) treated in parallel and in identical manner with FcRn+/+ tissues.

