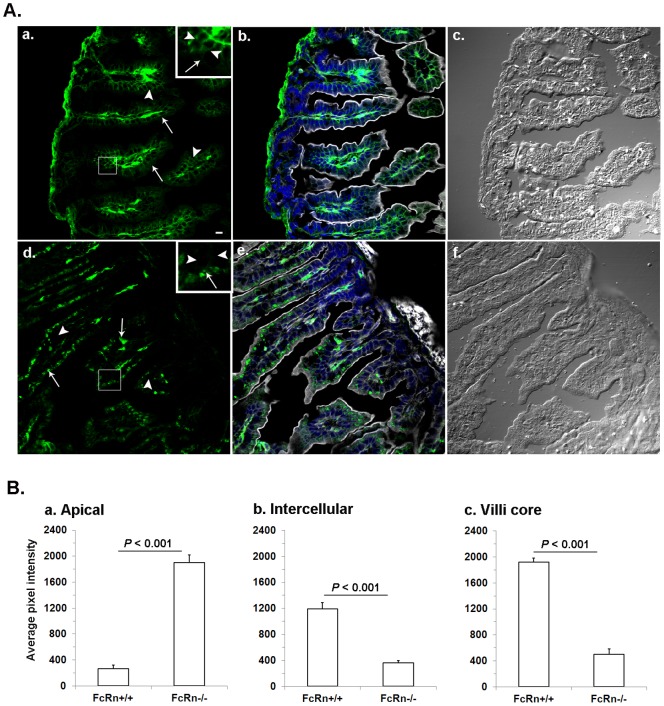
Figure 5. A comparison of IgG distribution between FcRn+/+ and FcRn−/− neonatal gut.
A. Photomicrographs illustrating gut sections from FcRn+/+ (a, b, c) and FcRn−/− (d, e, f) neonates labeled to visualize IgG (green) with goat anti-mouse IgG heavy chain Fc antibody. The phalloidin (gray) and DAPI (blue) labeling were used to mark cell boundaries and nucleus, respectively, as shown in b and e. For orientation DIC images in c and f are shown. The bar = 10 µm. The insets of a and b contain a higher magnified view of an outlined area of FcRn+/+ and FcRn−/− neonatal gut villi, respectively. The arrow heads point to the dense green labeling in intercellular areas of FcRn+/+ enterocytes and lack of it in FcRn−/−. The presence or lack, respectively, of dense green blobs in FcRn−/− and FcRn+/+ apical areas is marked by a solid arrow. B. Quantitative analyses of IgG in apical, intercellular and core villi areas are shown. Fluorescence images such as shown in panel A (a and c) were collected on a confocal microscope. The images were quantified, averaged for 300 cells, and the average intensity plus or minus standard deviations was plotted for each strain (n = 3 FcRn+/+ and 3 FcRn−/− mice). a. The FcRn−/− apical area filled with green structures measured to be ∼7 times more intense than FcRn+/+ areas. b. The intercellular IgG in FcRn+/+ is ∼3 times more intense than FcRn−/− intercellular areas. c. IgG in the FcRn+/+ jejunum villi core is ∼4 times more intense than the FcRn−/− villi core areas.

